Quantum
Design of an enterprise manufacturing data analytics tool — enabling efficient, feature-based data exploration with centralized specifications at Google.
Overview
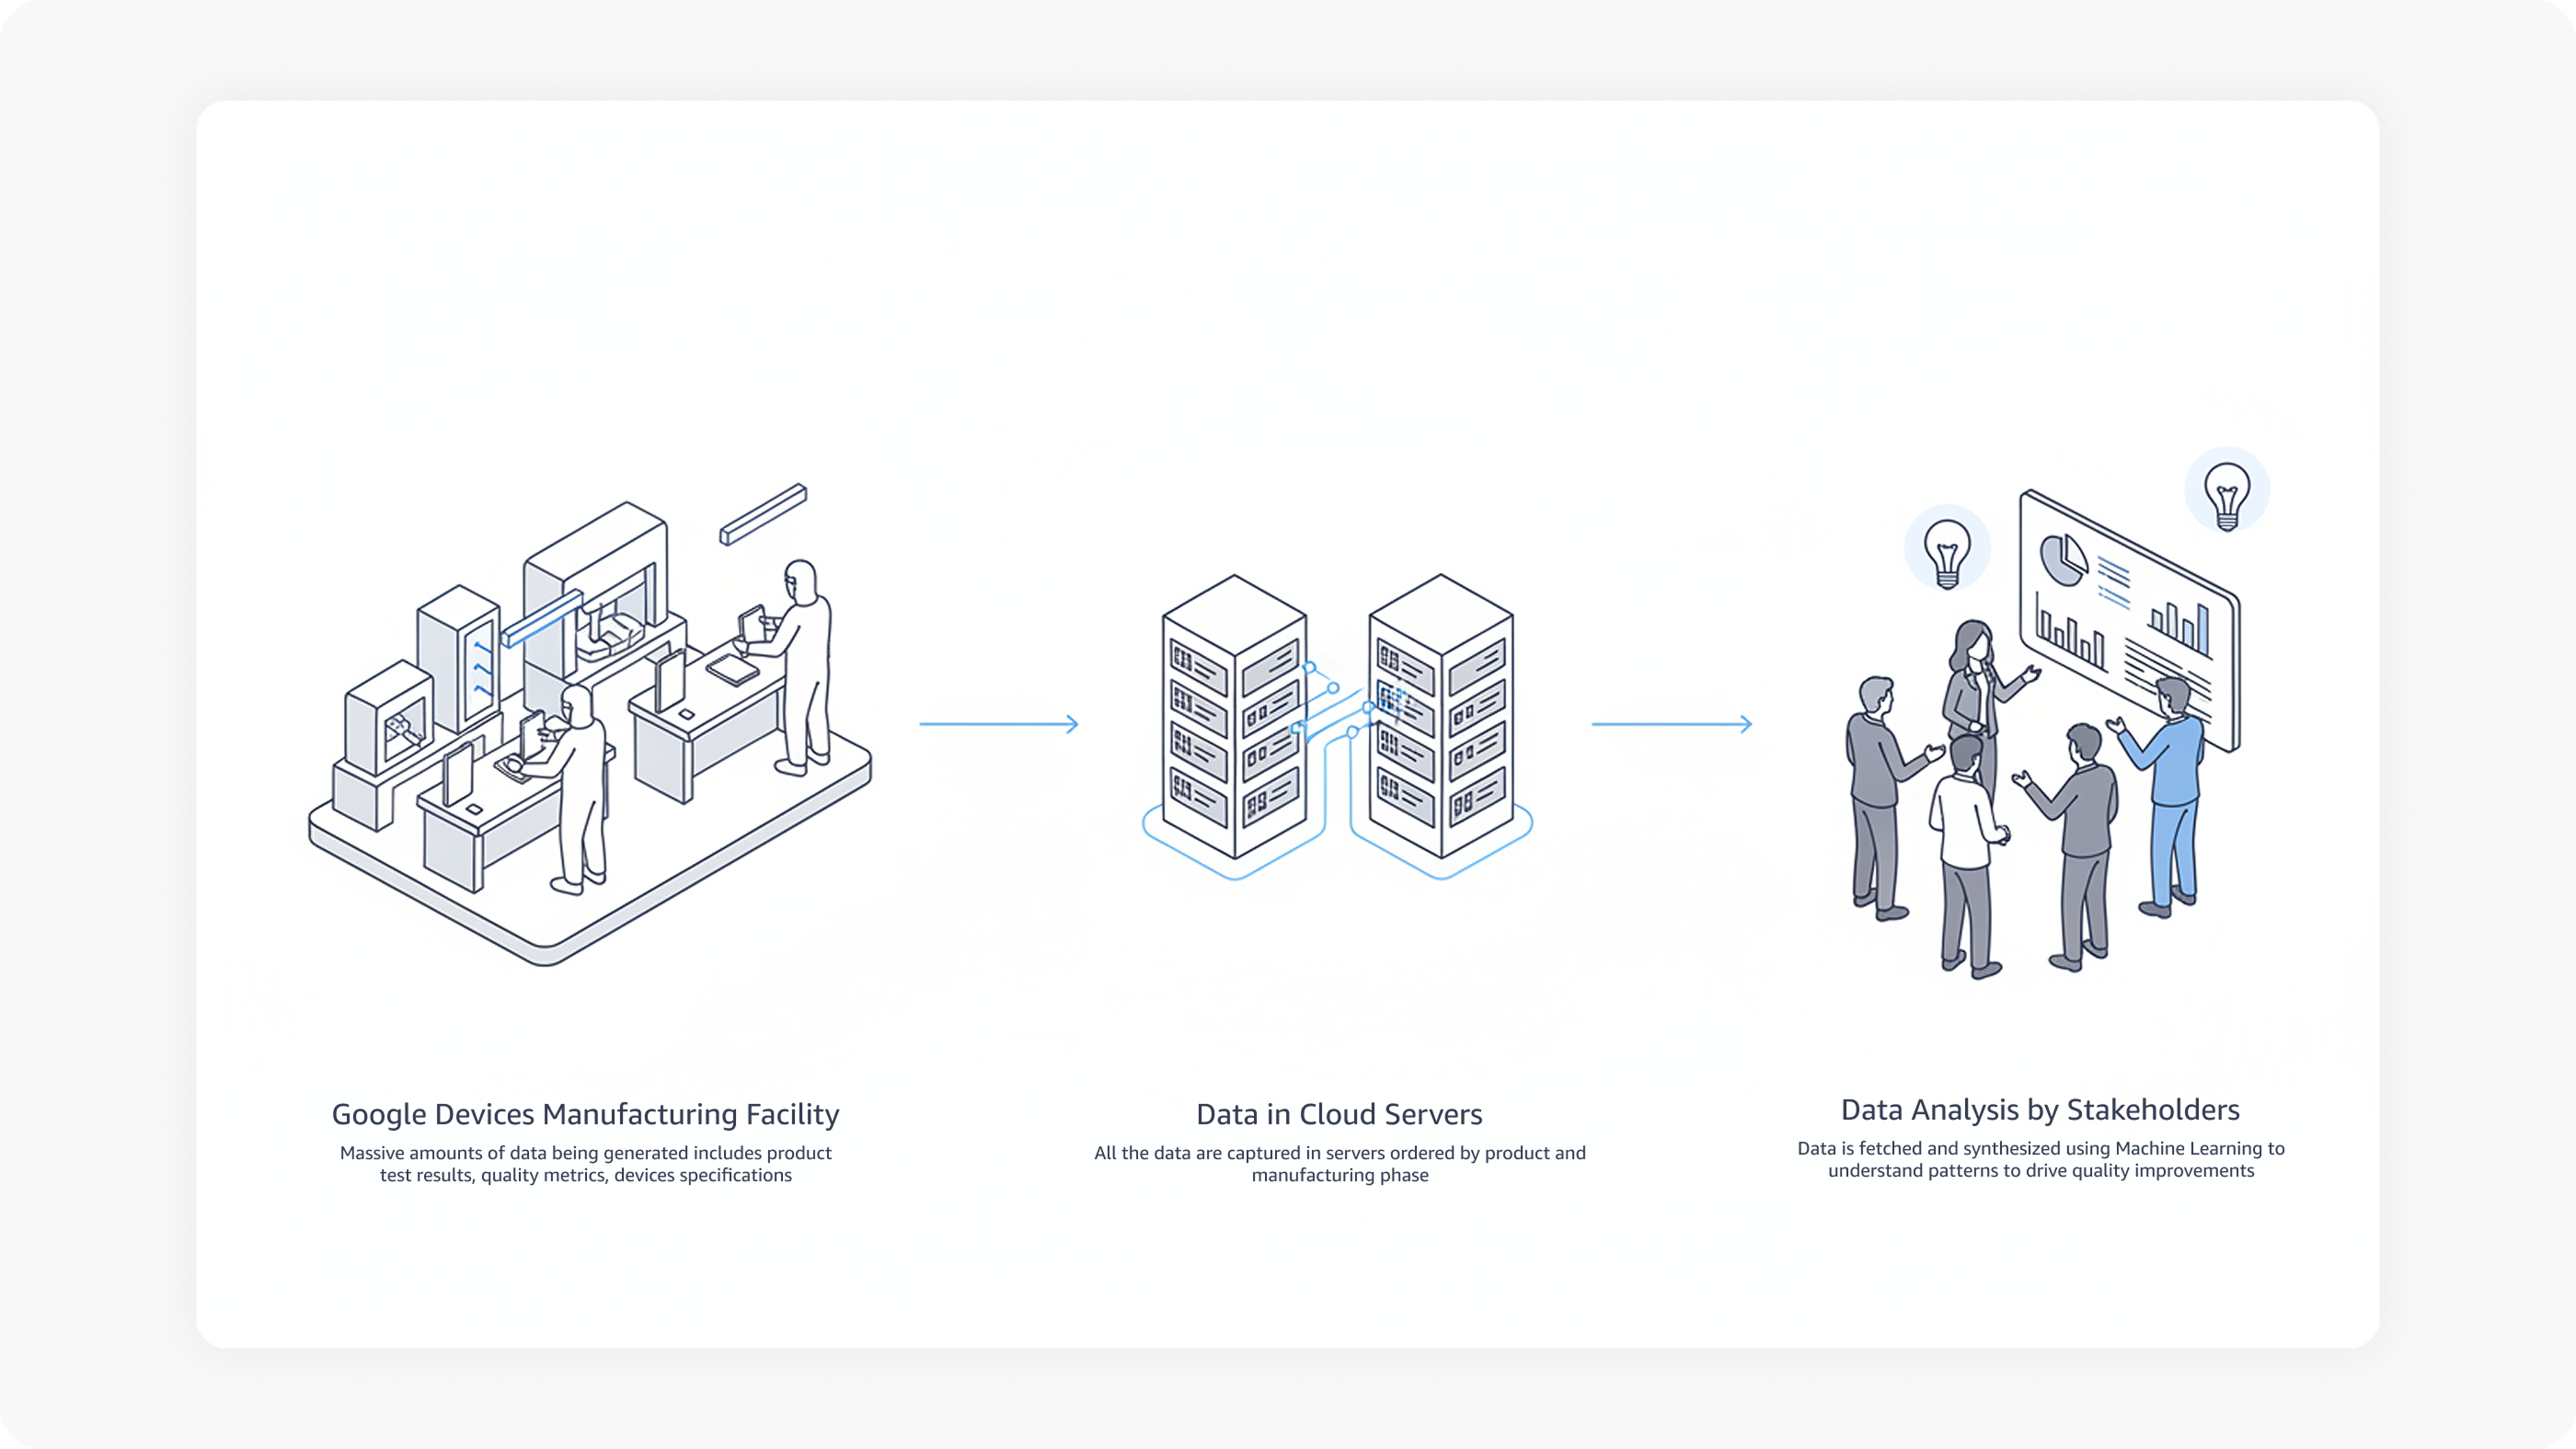
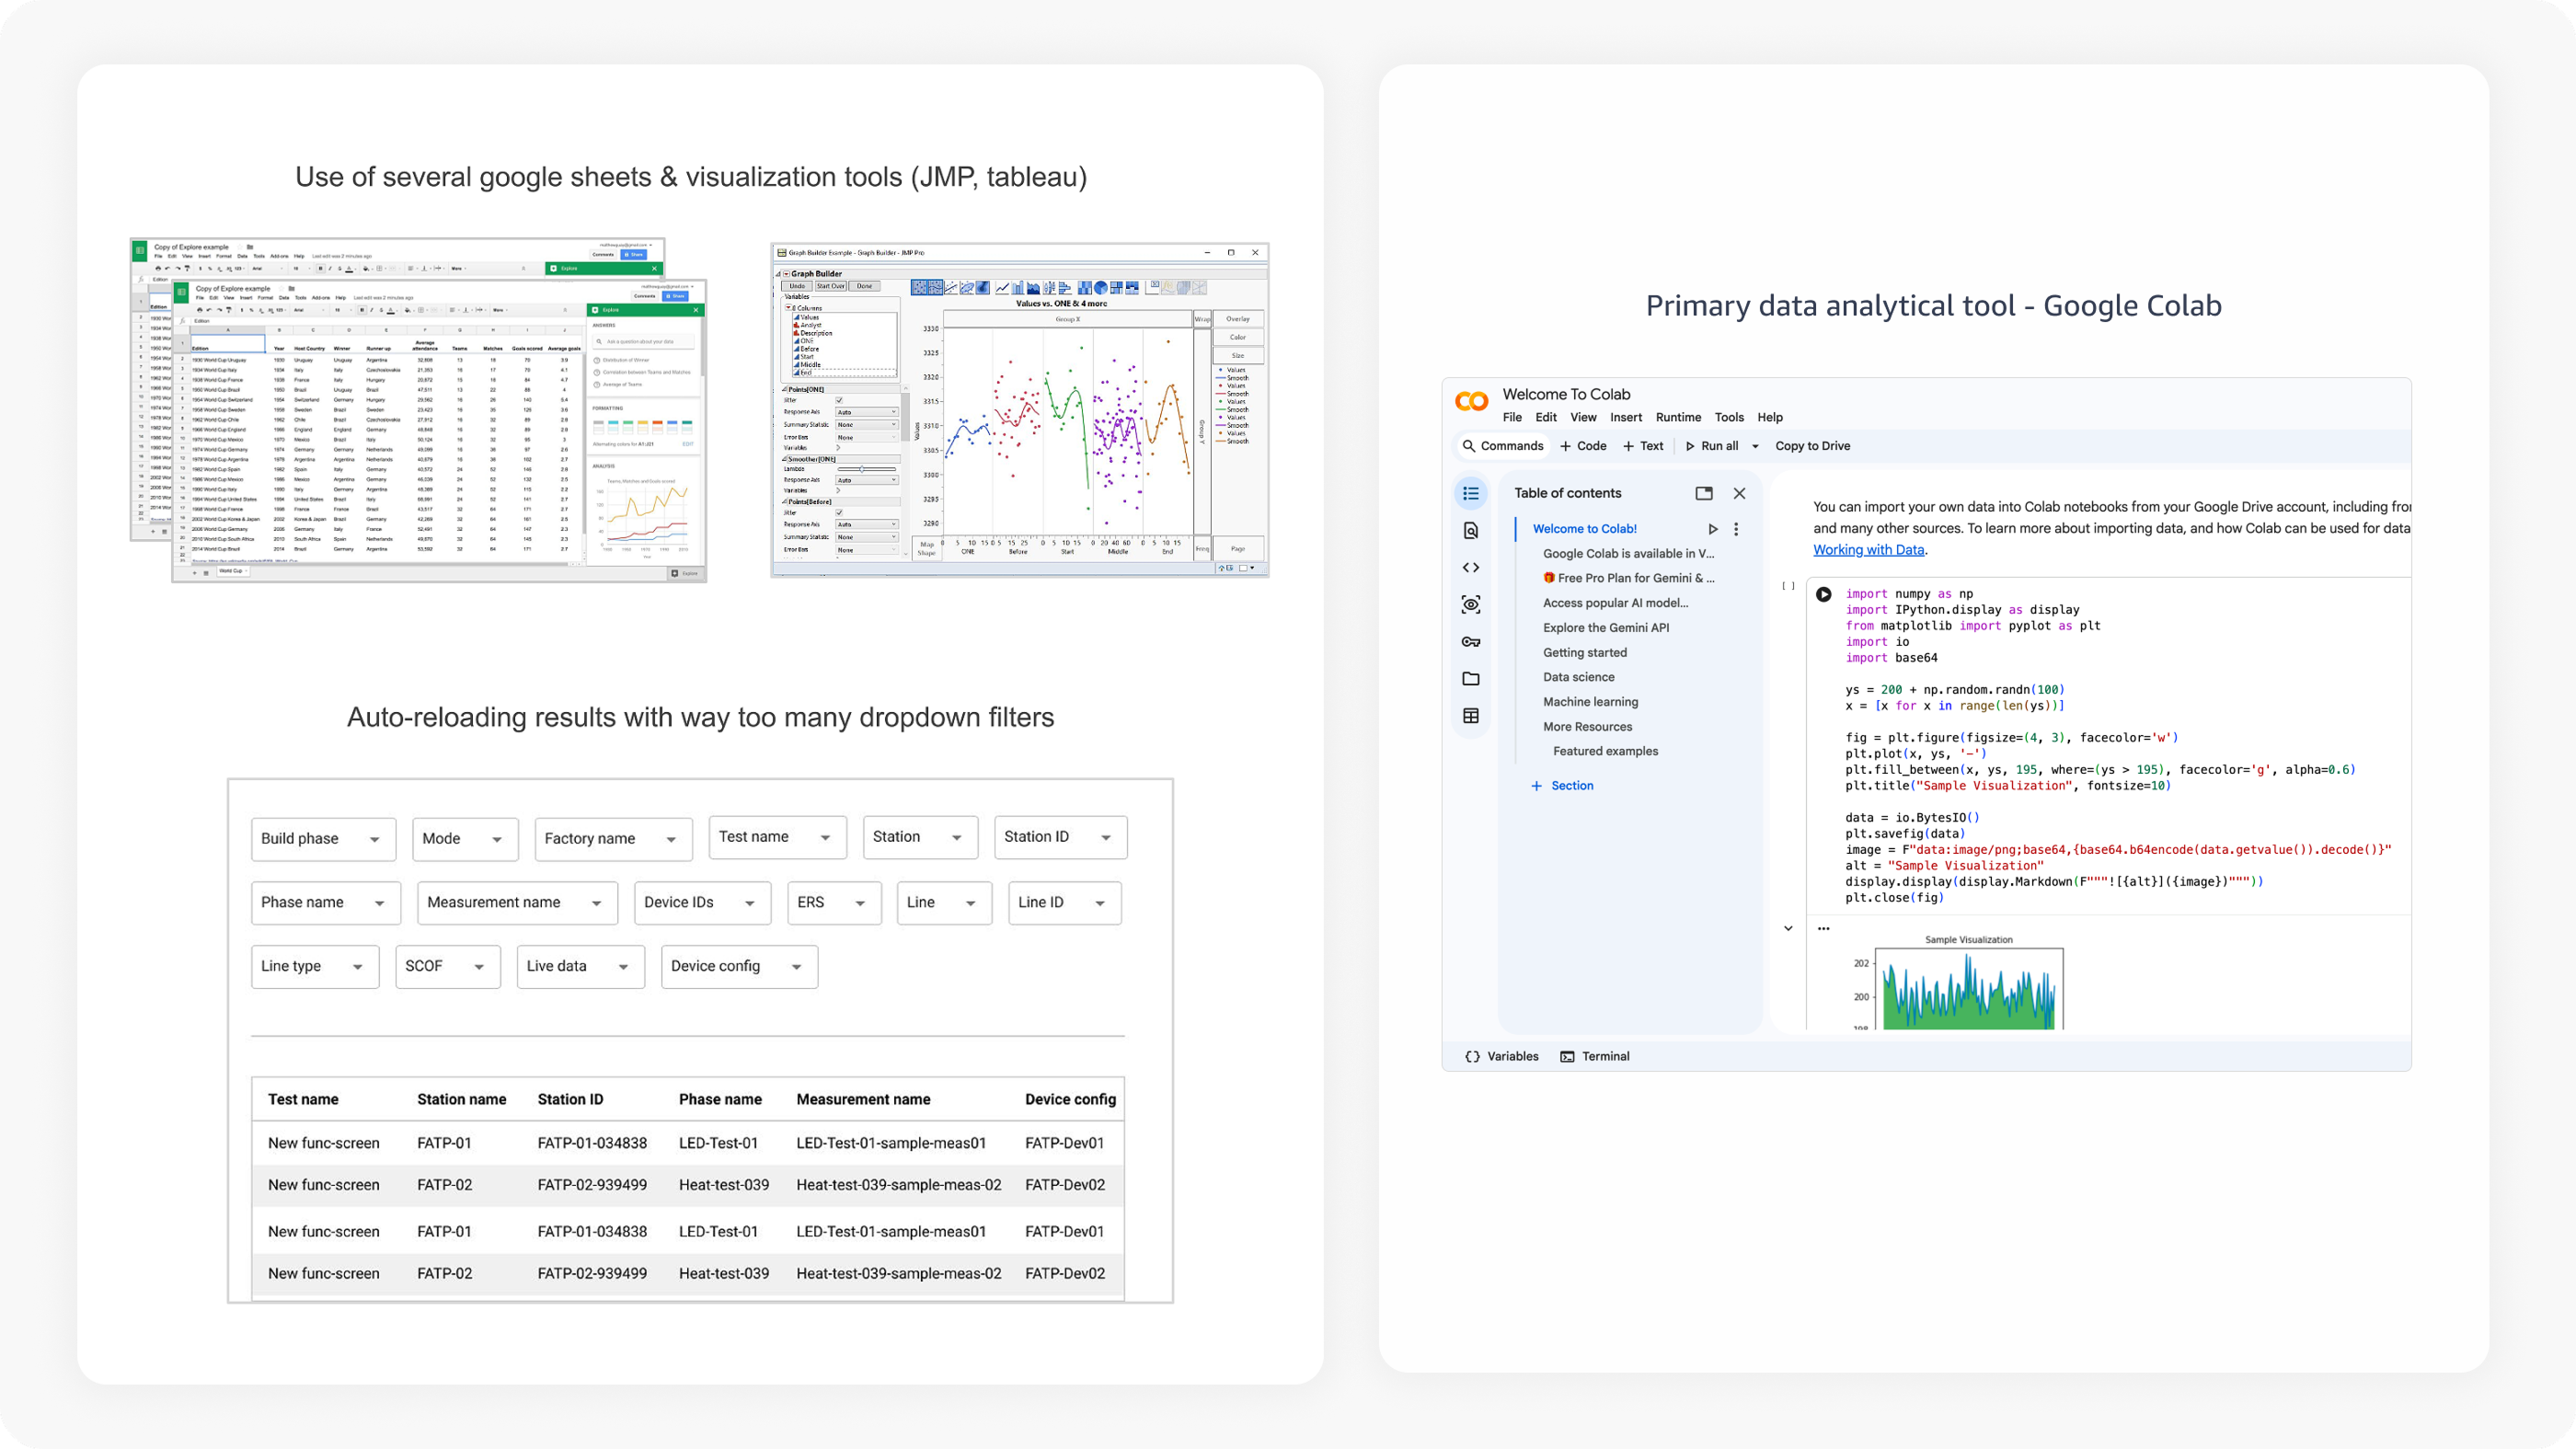
Huge volumes of complex manufacturing data are generated during mass production of Google hardware products. Teams needed to explore and understand patterns in this data, but faced challenges around data inconsistencies, inefficient access modes, and security barriers — leading to heavy reliance on scattered Google Sheets and visualization tools with too many dropdown filters.
The Problem
Research Insights
Our research with program managers and test engineers surfaced three key issues.

Lack of consistent data specifications. Cross-functional teams used different tools with different data definitions, leading to conflicting scenarios during reporting.
Data-intensive views aren’t always preferred. Senior executives and product managers wanted glanceable content with top issues and yield trends — not complex, data-busy visualizations.
Fragmented experience for feature-based queries. Users framed questions using “if…else” connectors, but answering these required numerous filters — an inefficient and difficult process.
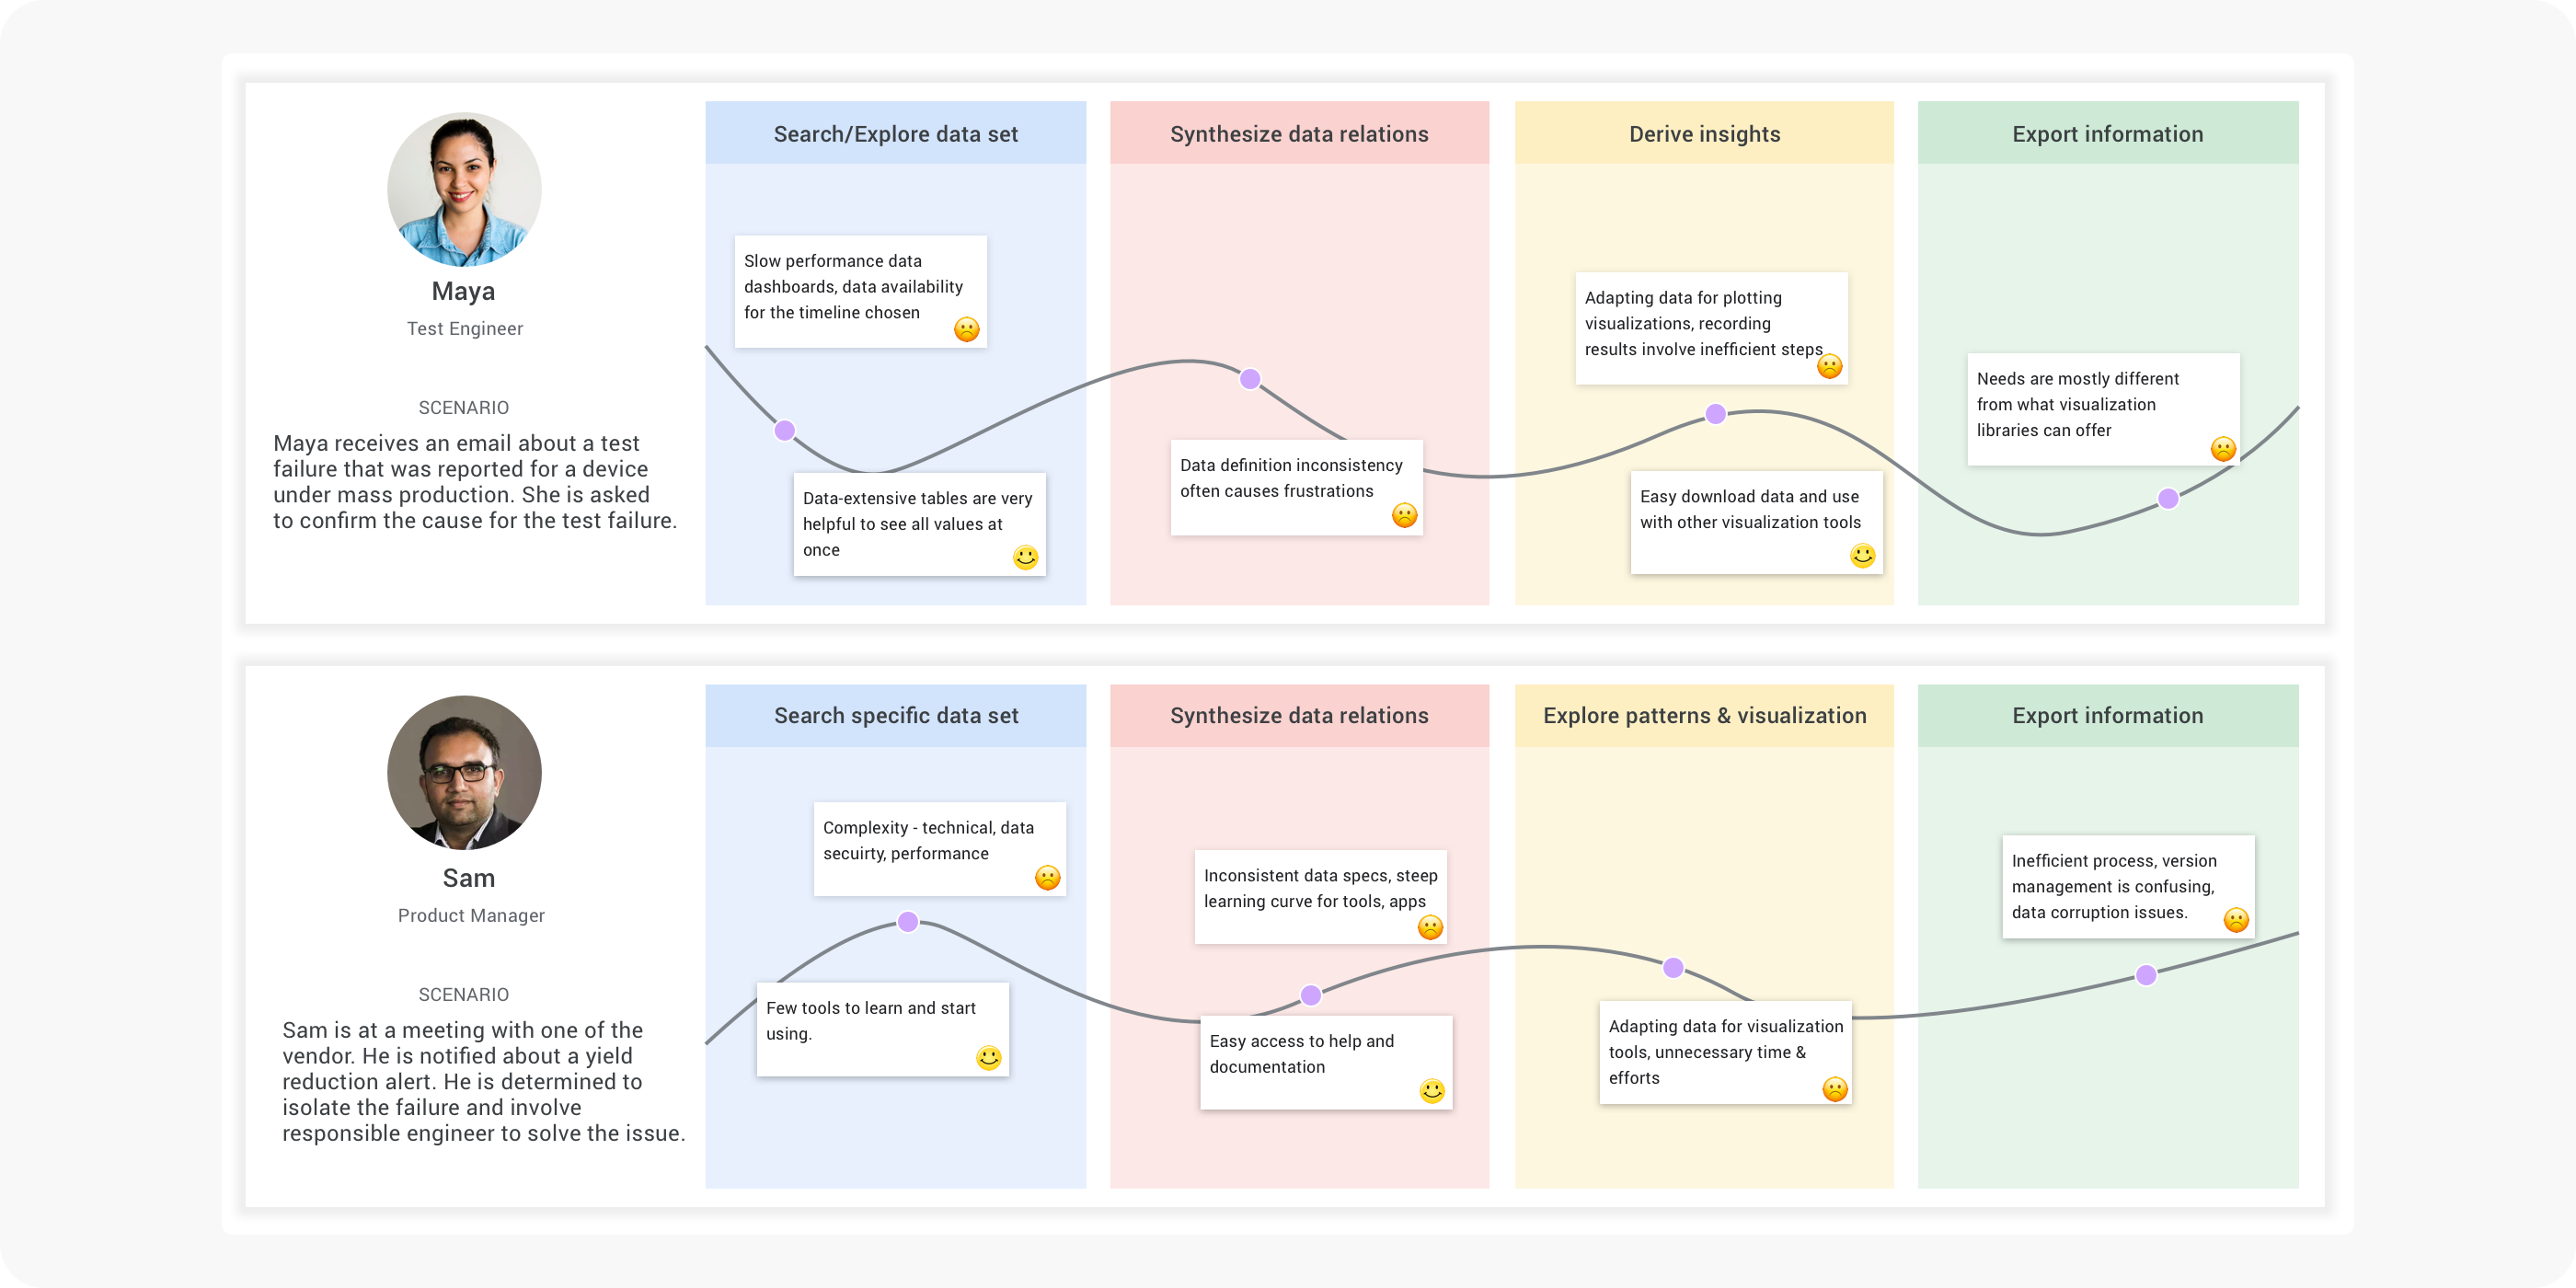
Personas
Personas representing our core user types across the manufacturing data workflow.

How Might We
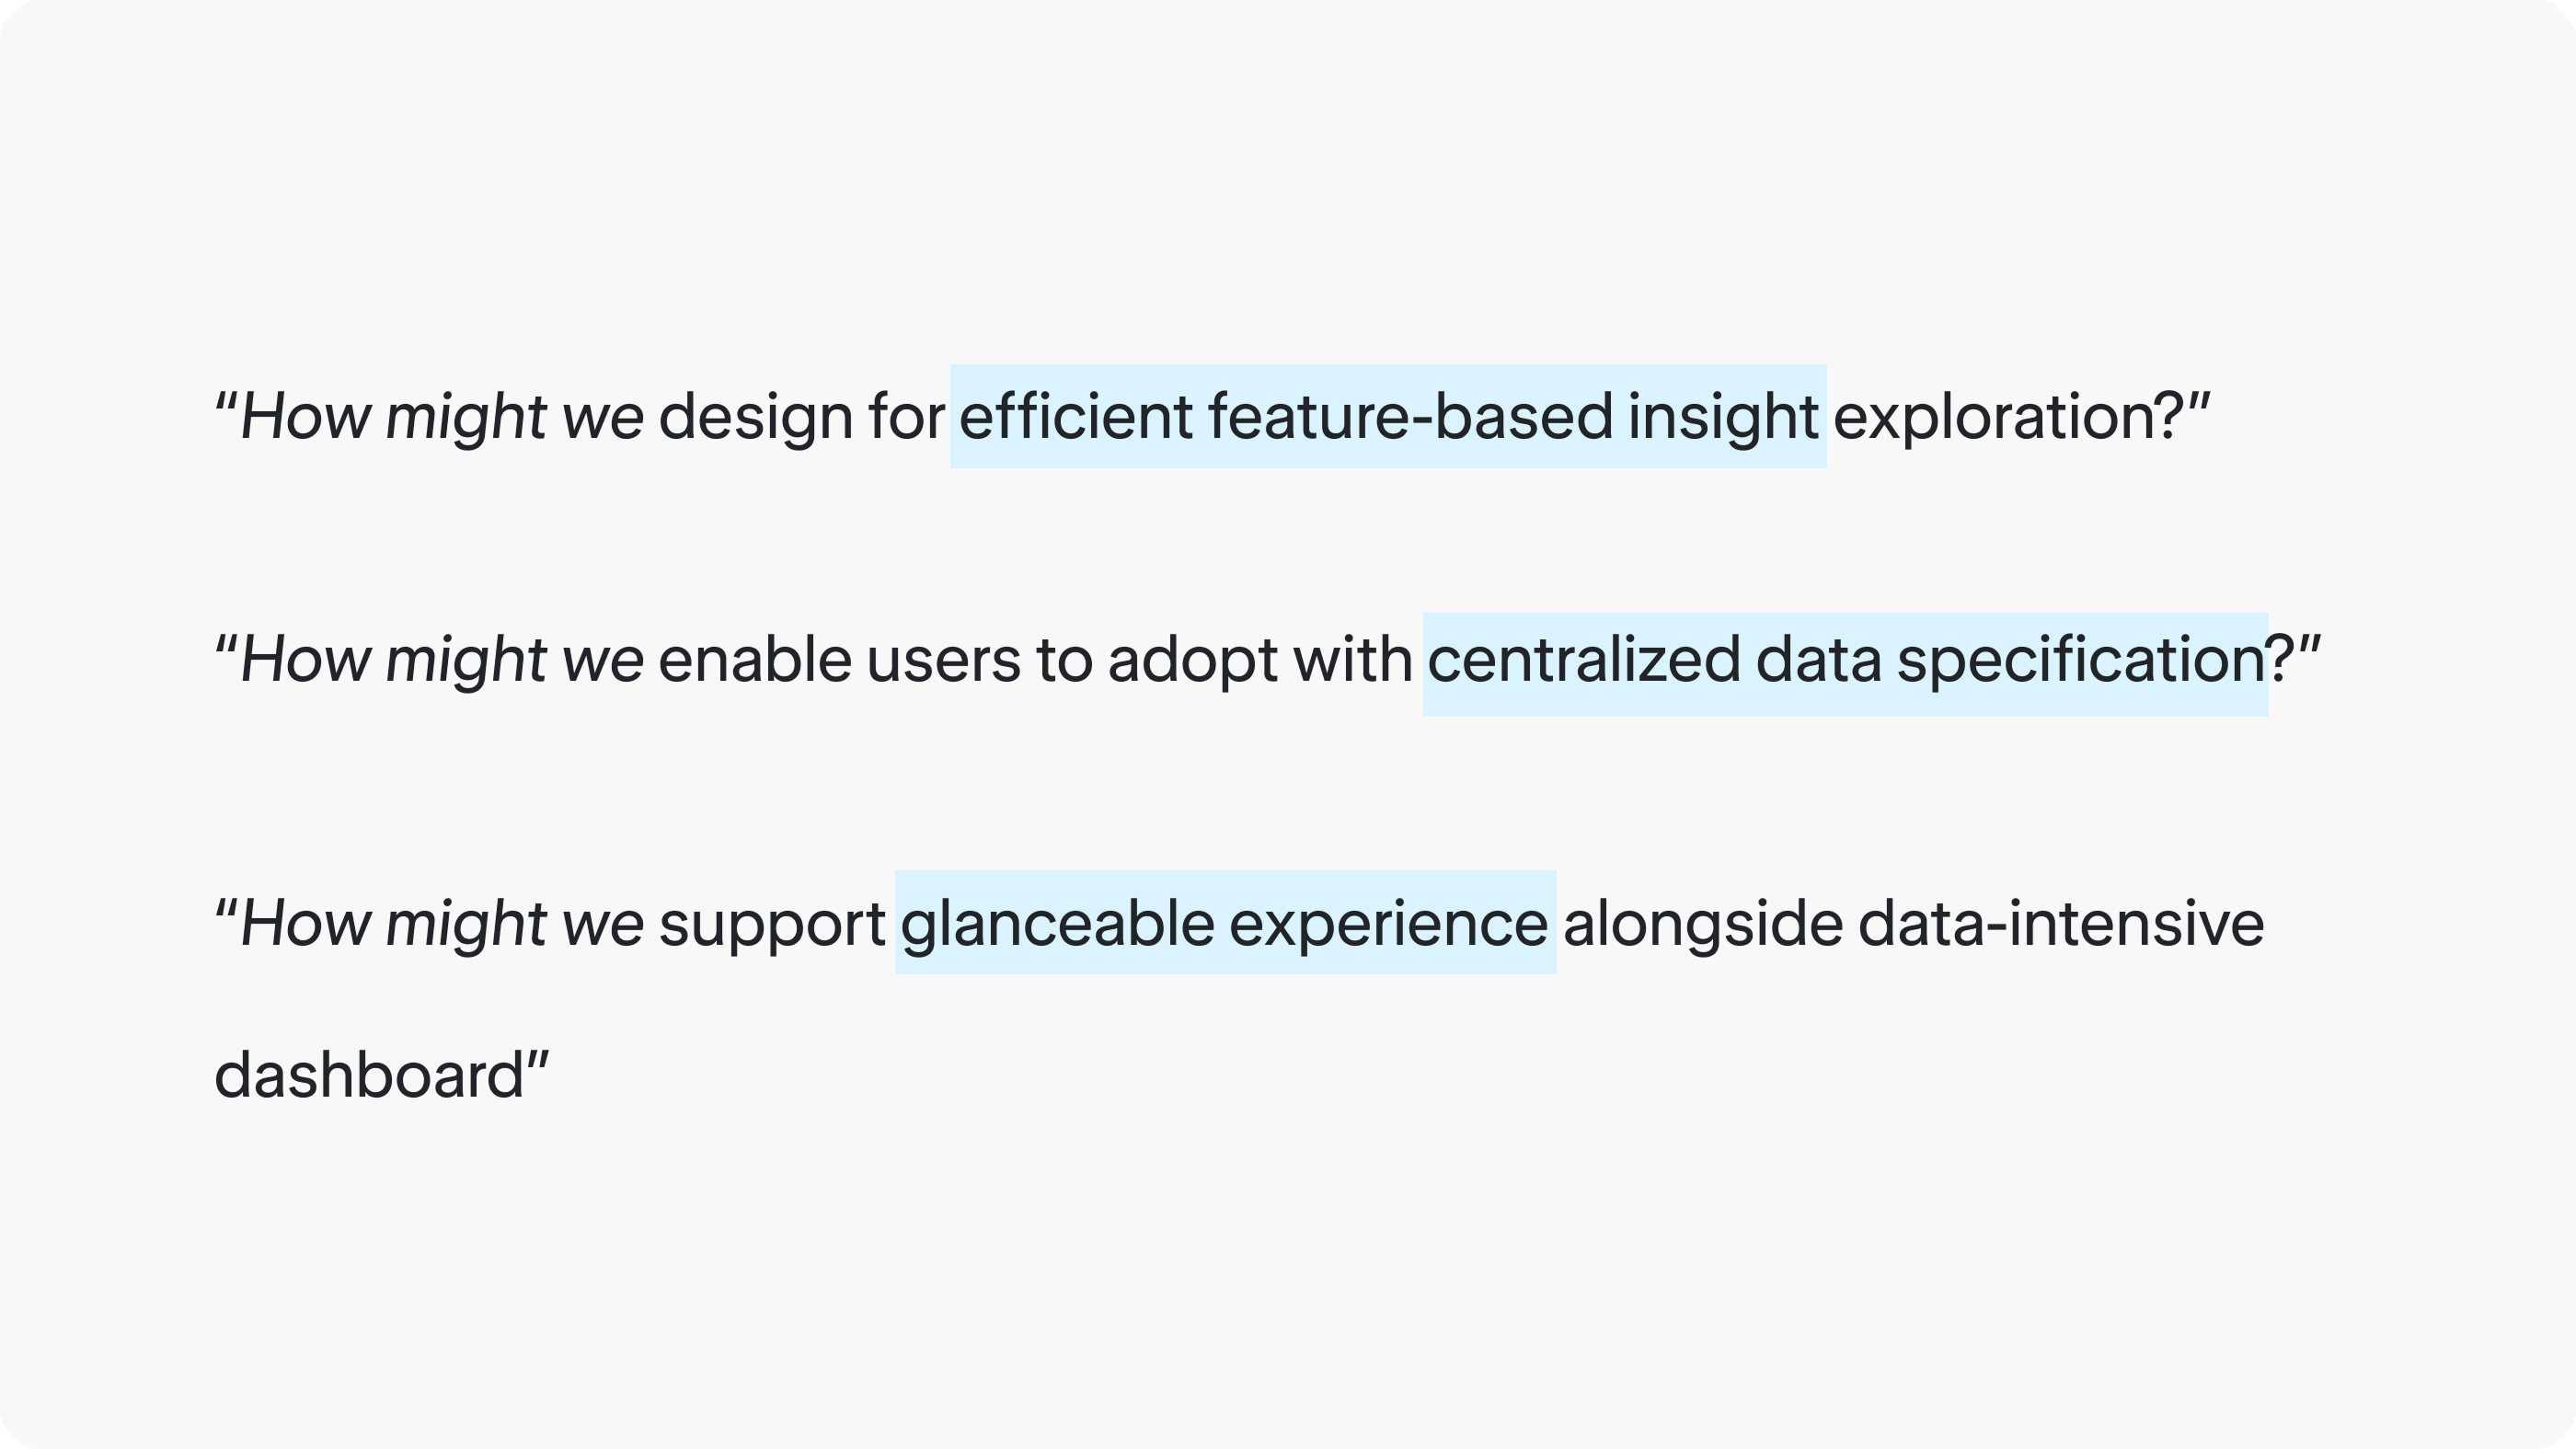
How might we design for efficient feature-based insight exploration with centralized data specification and support glanceable experience alongside data-intensive dashboard?
Critical User Journeys
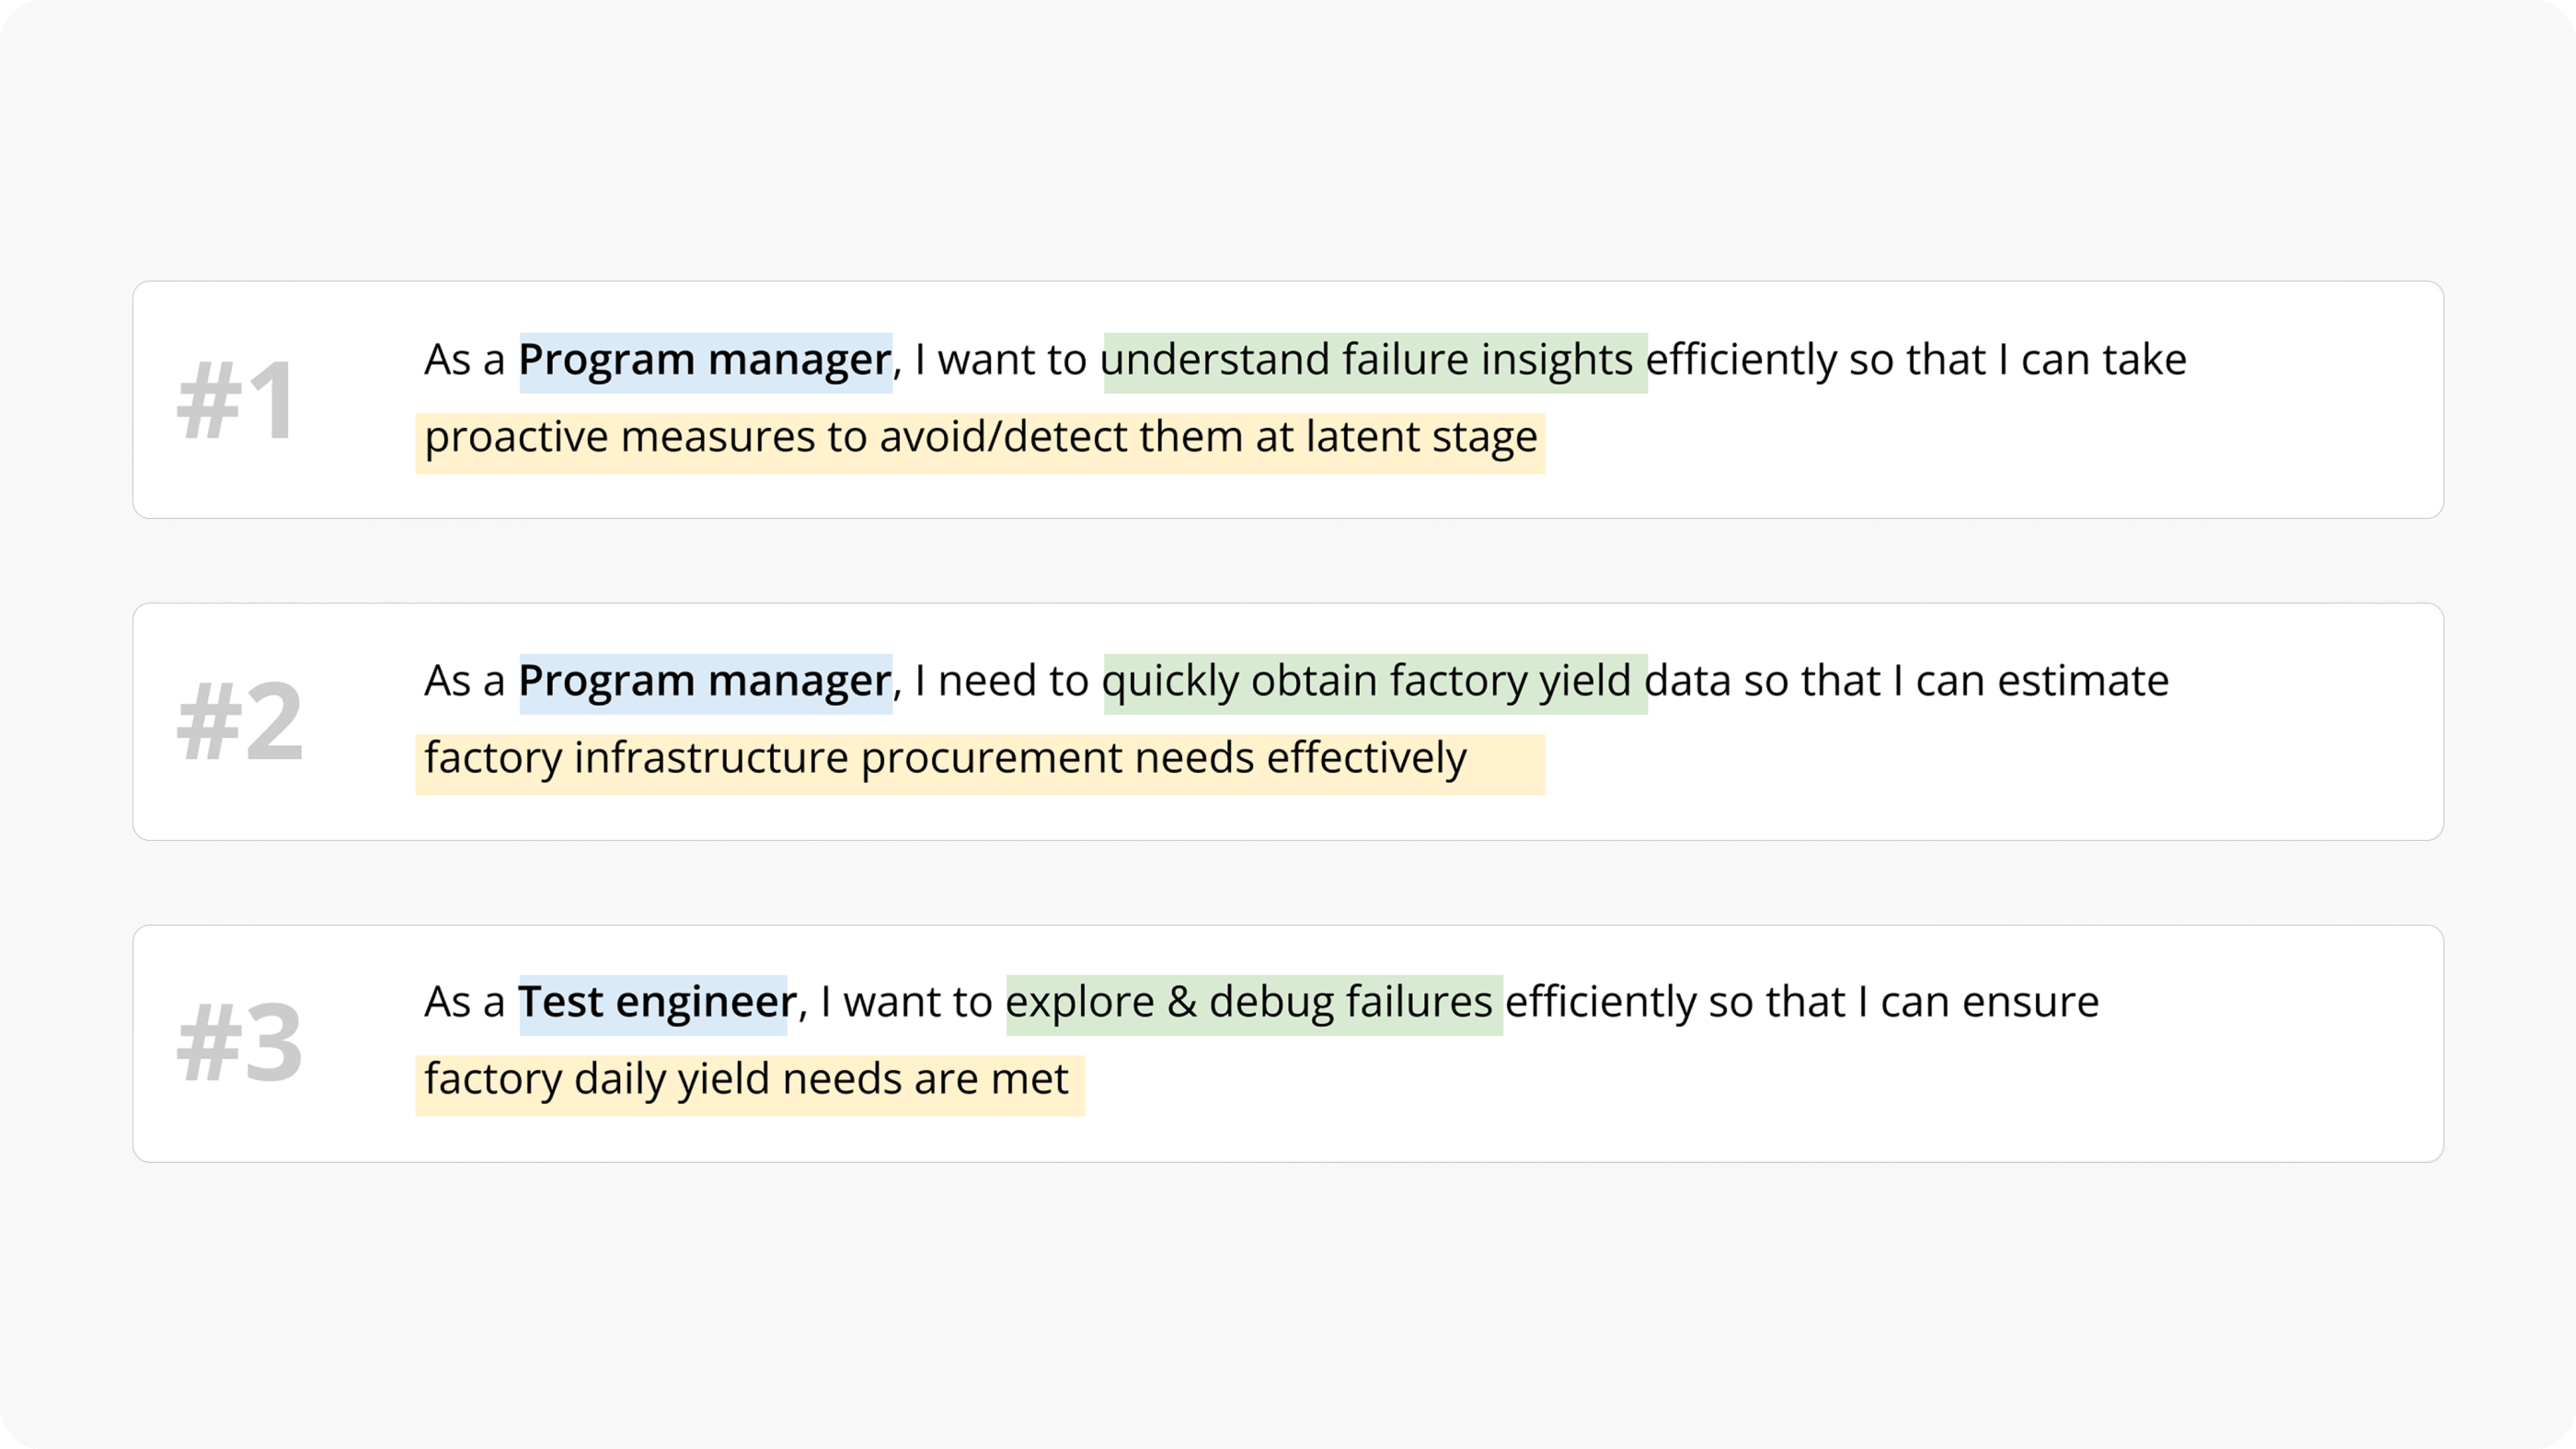
We mapped three core user journeys connecting users with their deeper goals.
Concept Generation
Within a group of all stakeholder representatives — test engineers, PMs, executives, vendor teams — we generated concepts, voted on them, and prioritized using an Impact vs. Effort matrix.
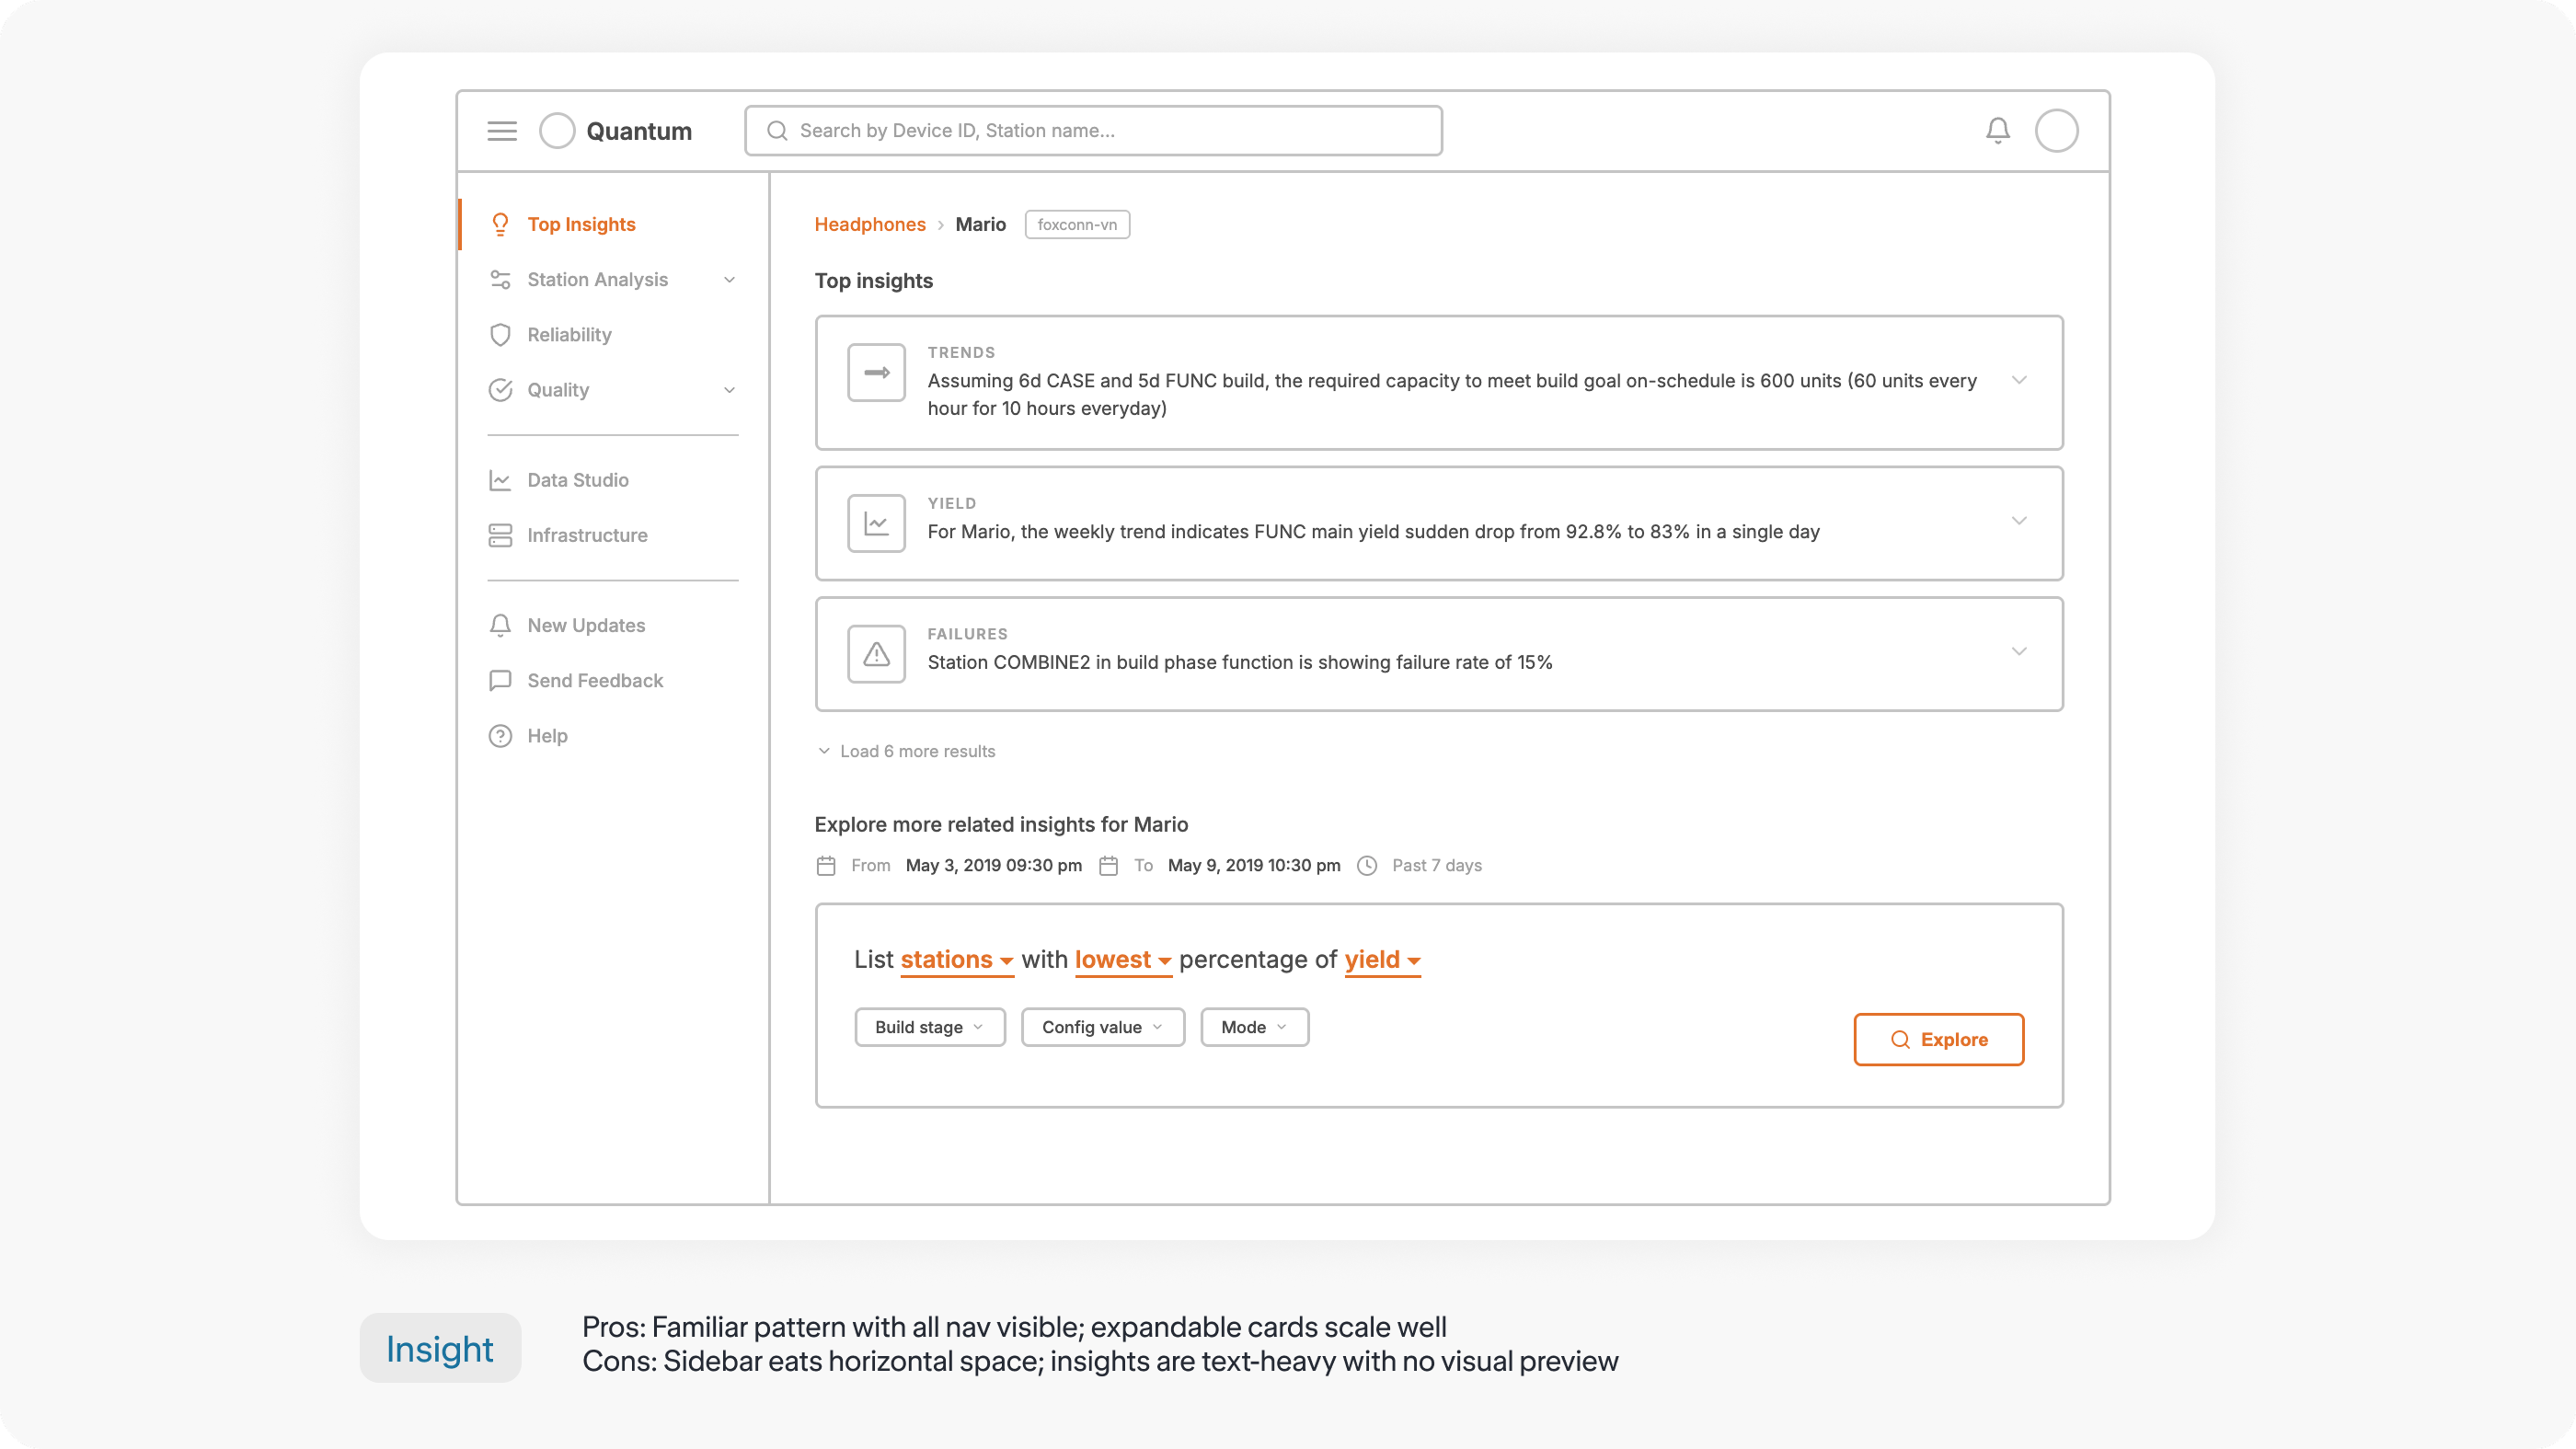
Concept A
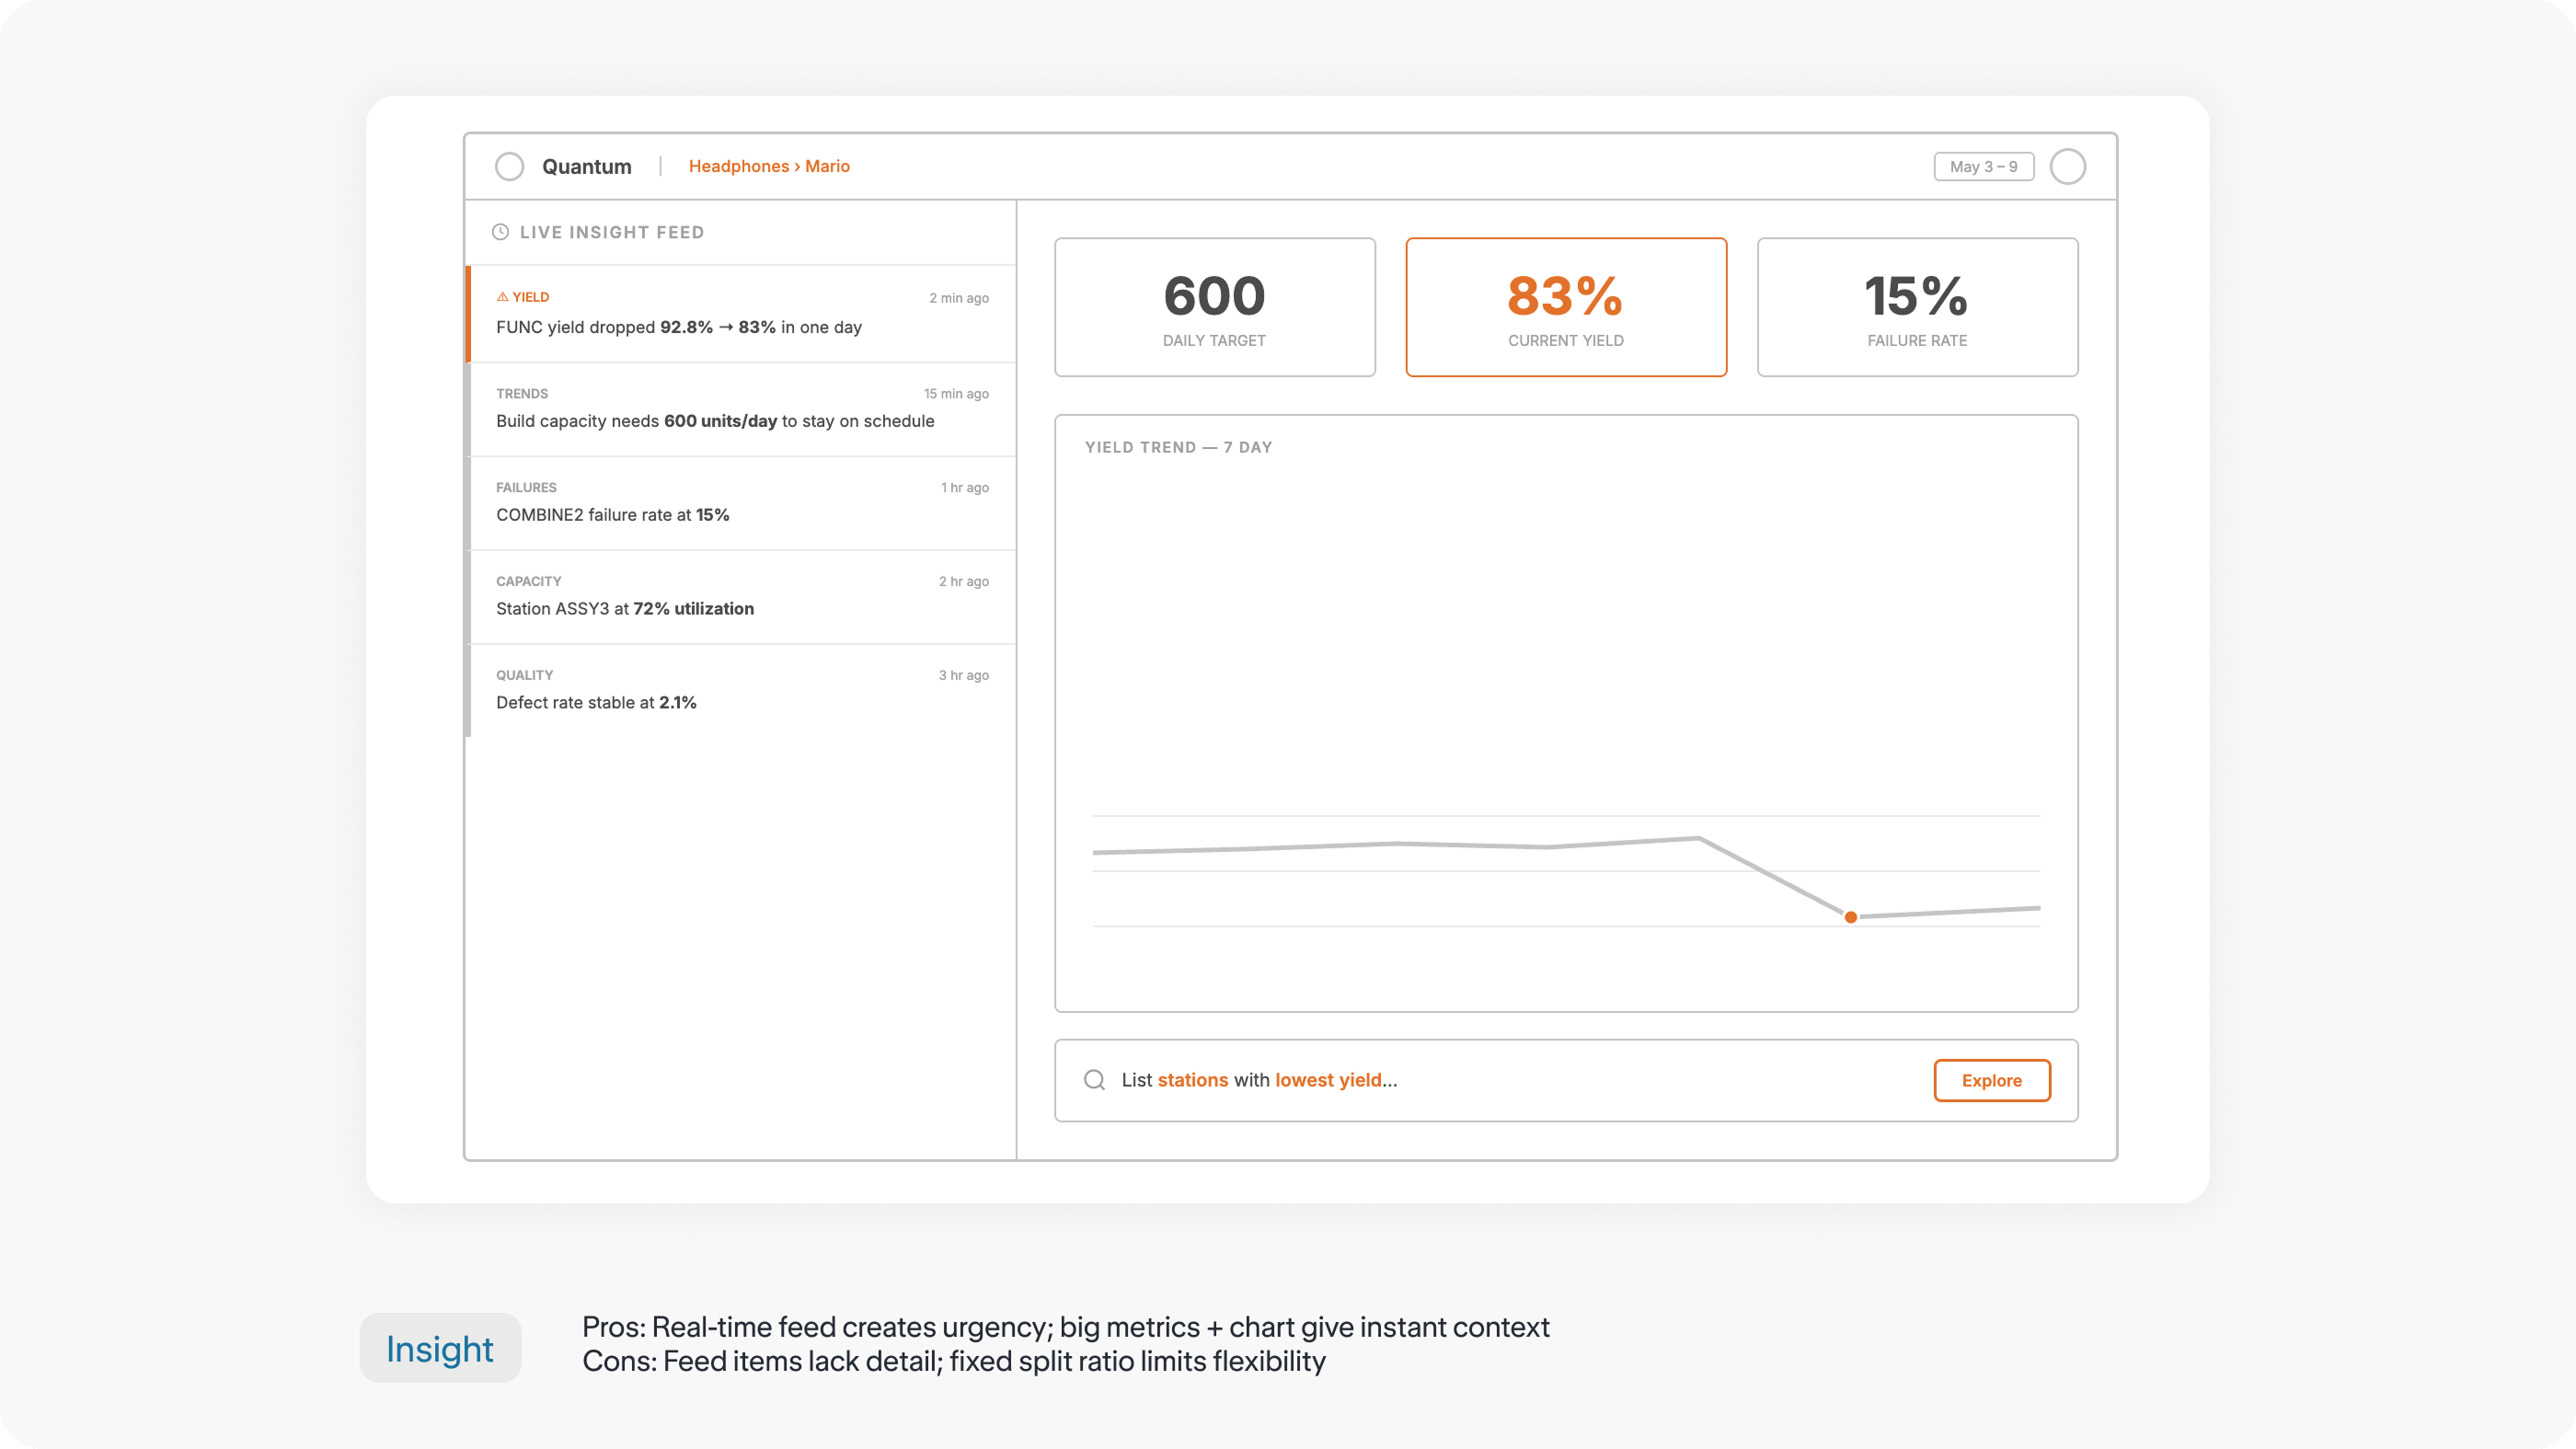
Concept B
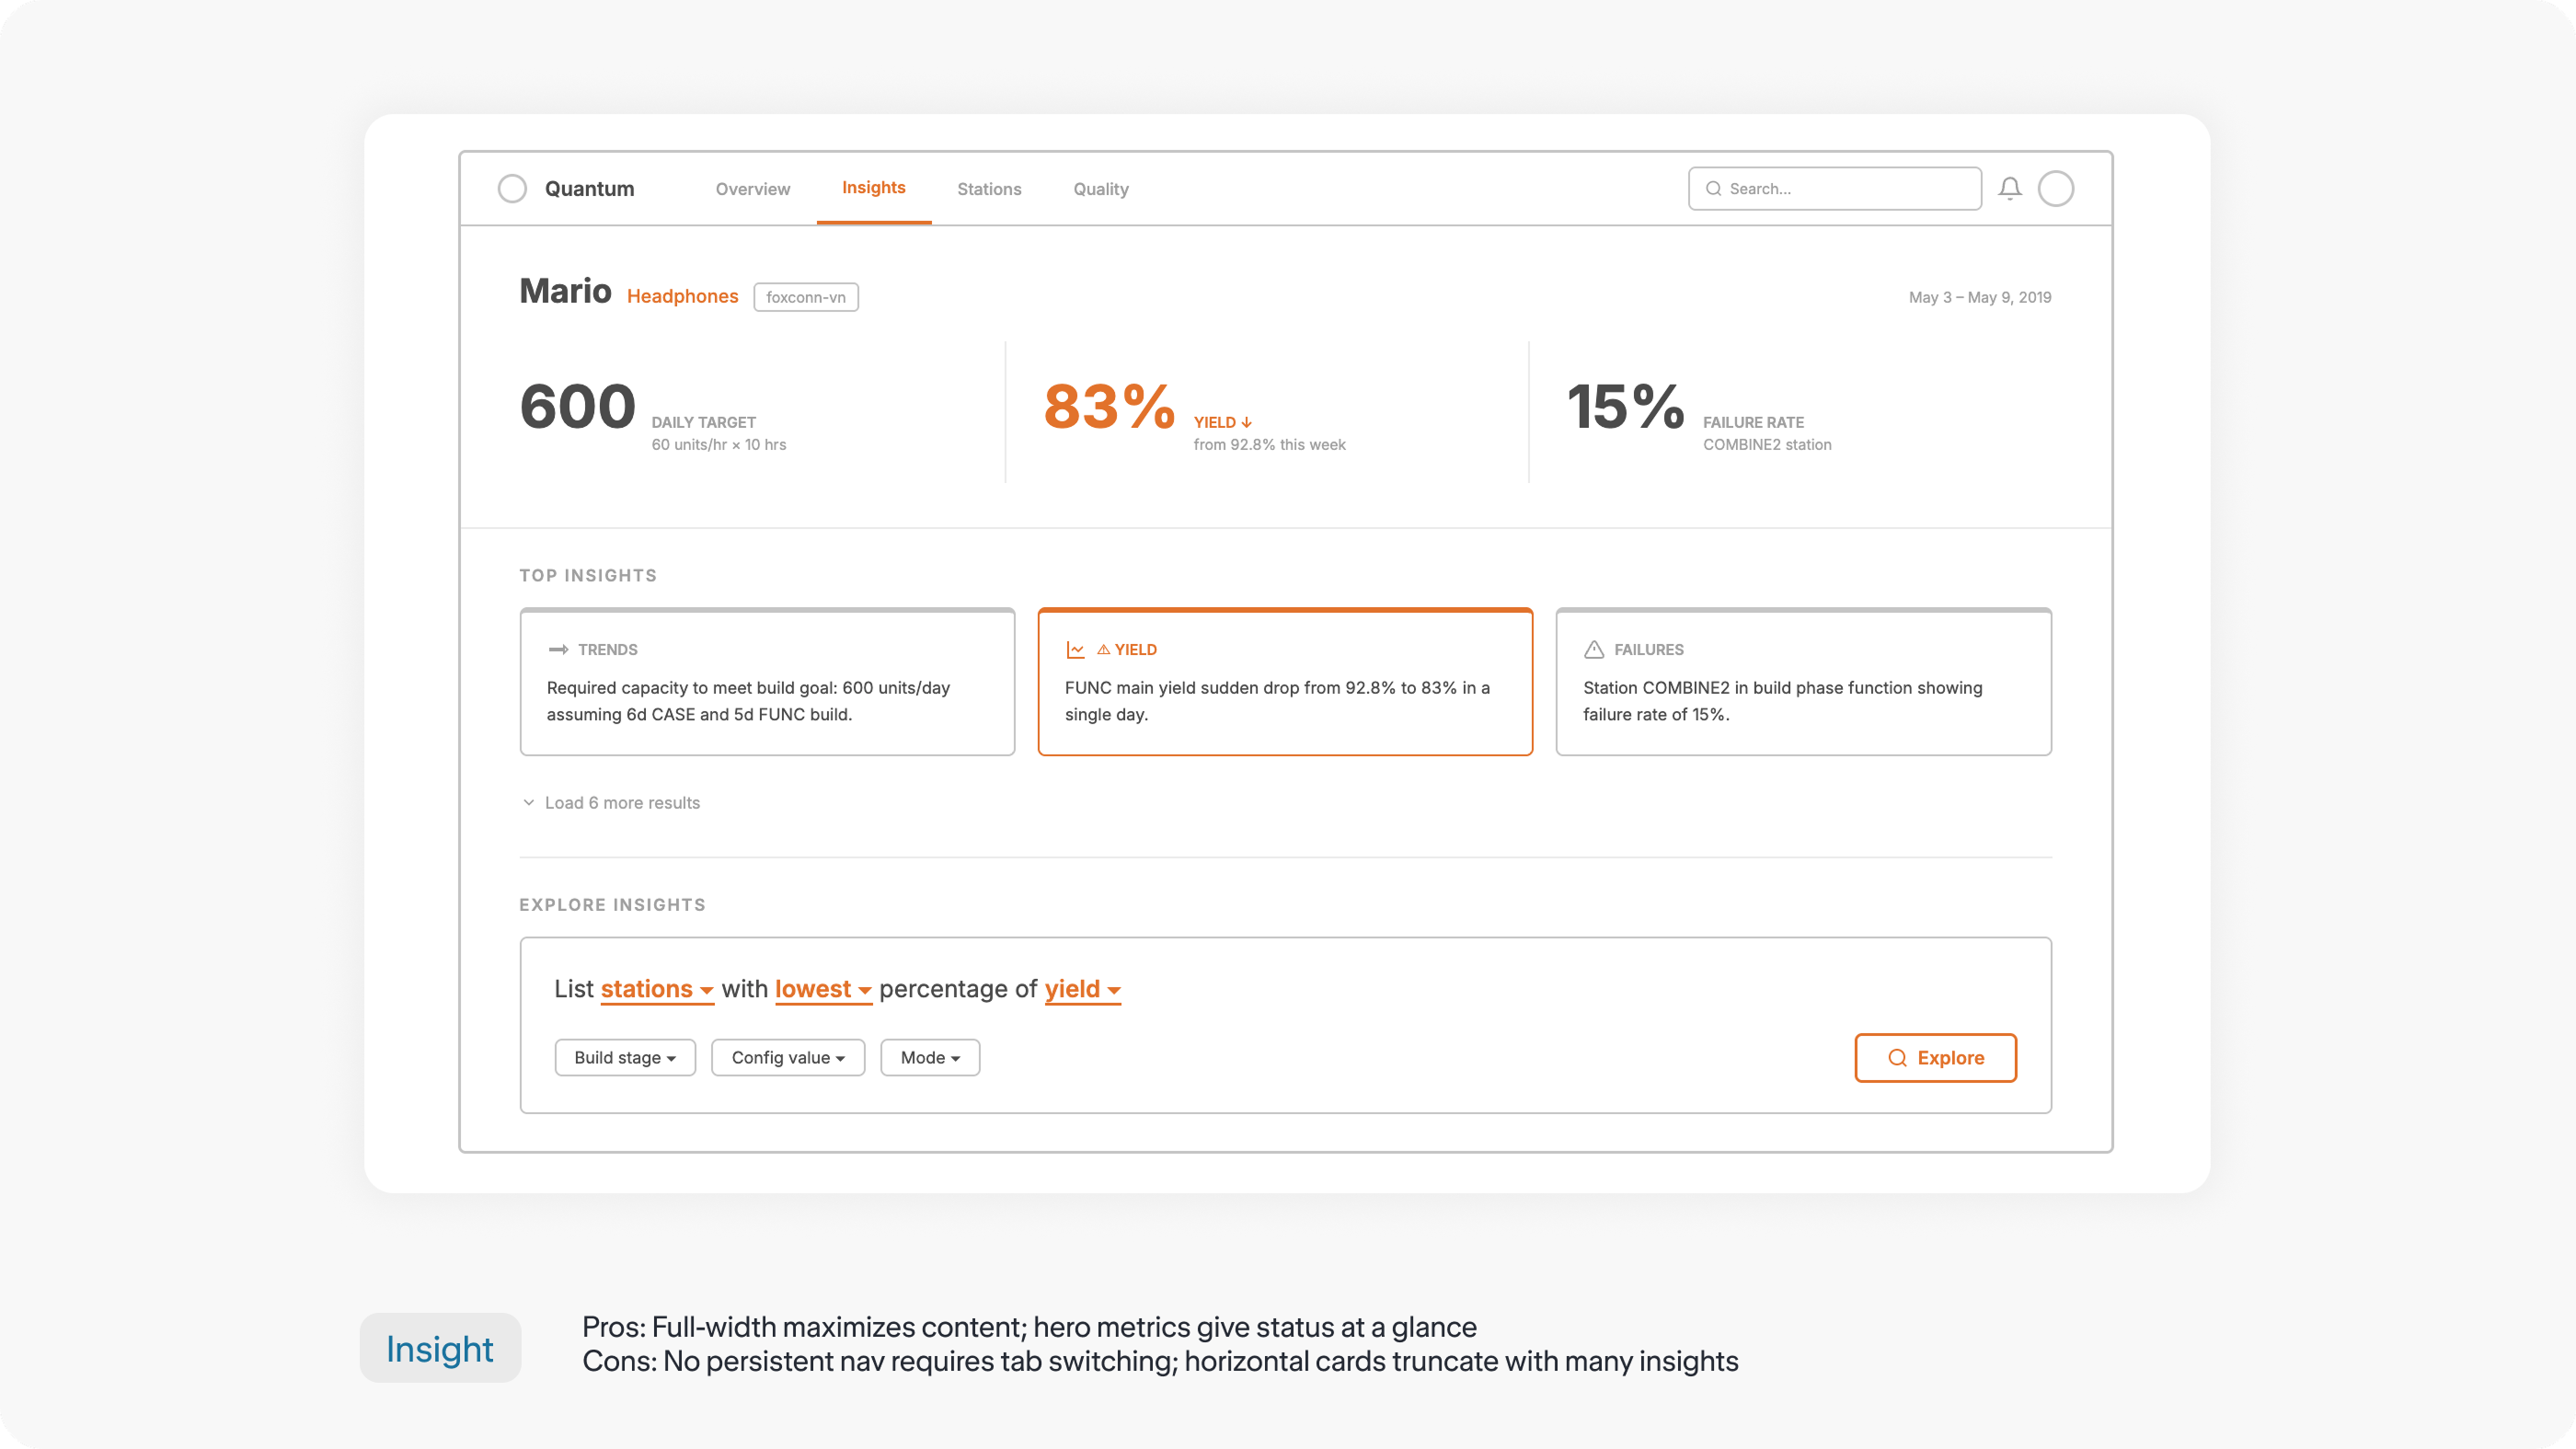
Concept C
Prototyping & Design Iterations
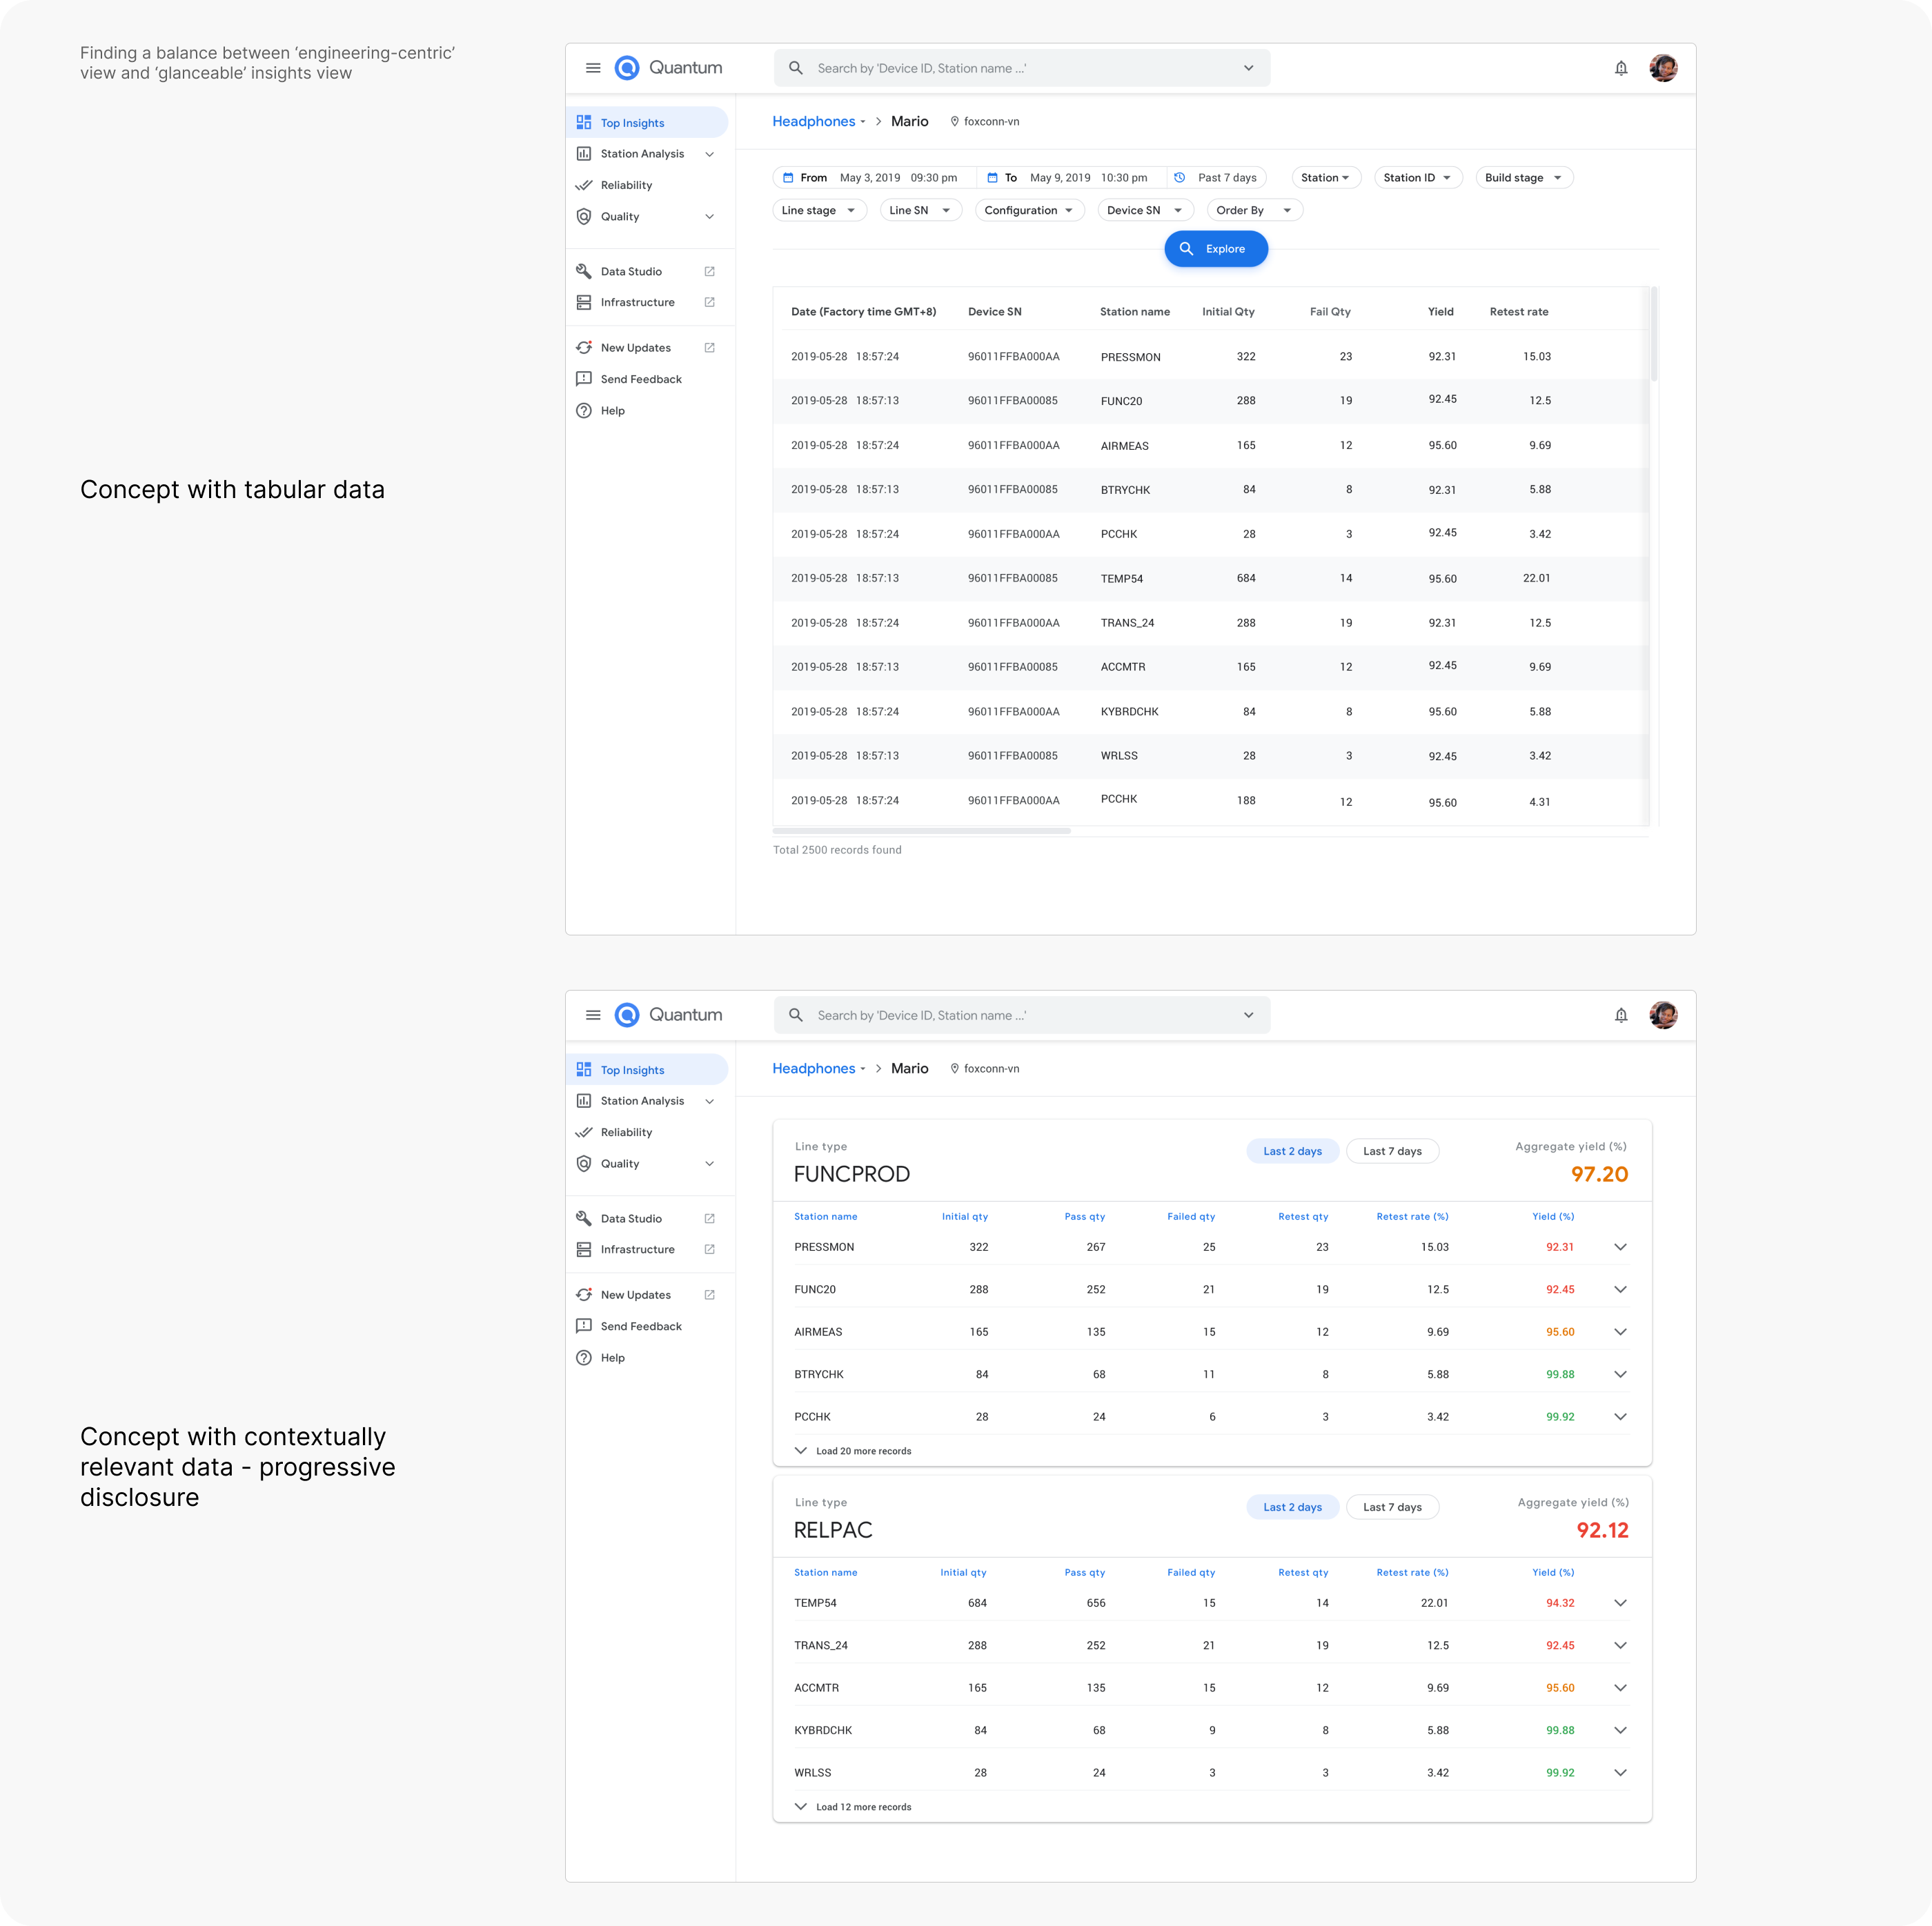
Progressive Content Disclosure
Finding the right balance between engineering-centric views and glanceable insight views.
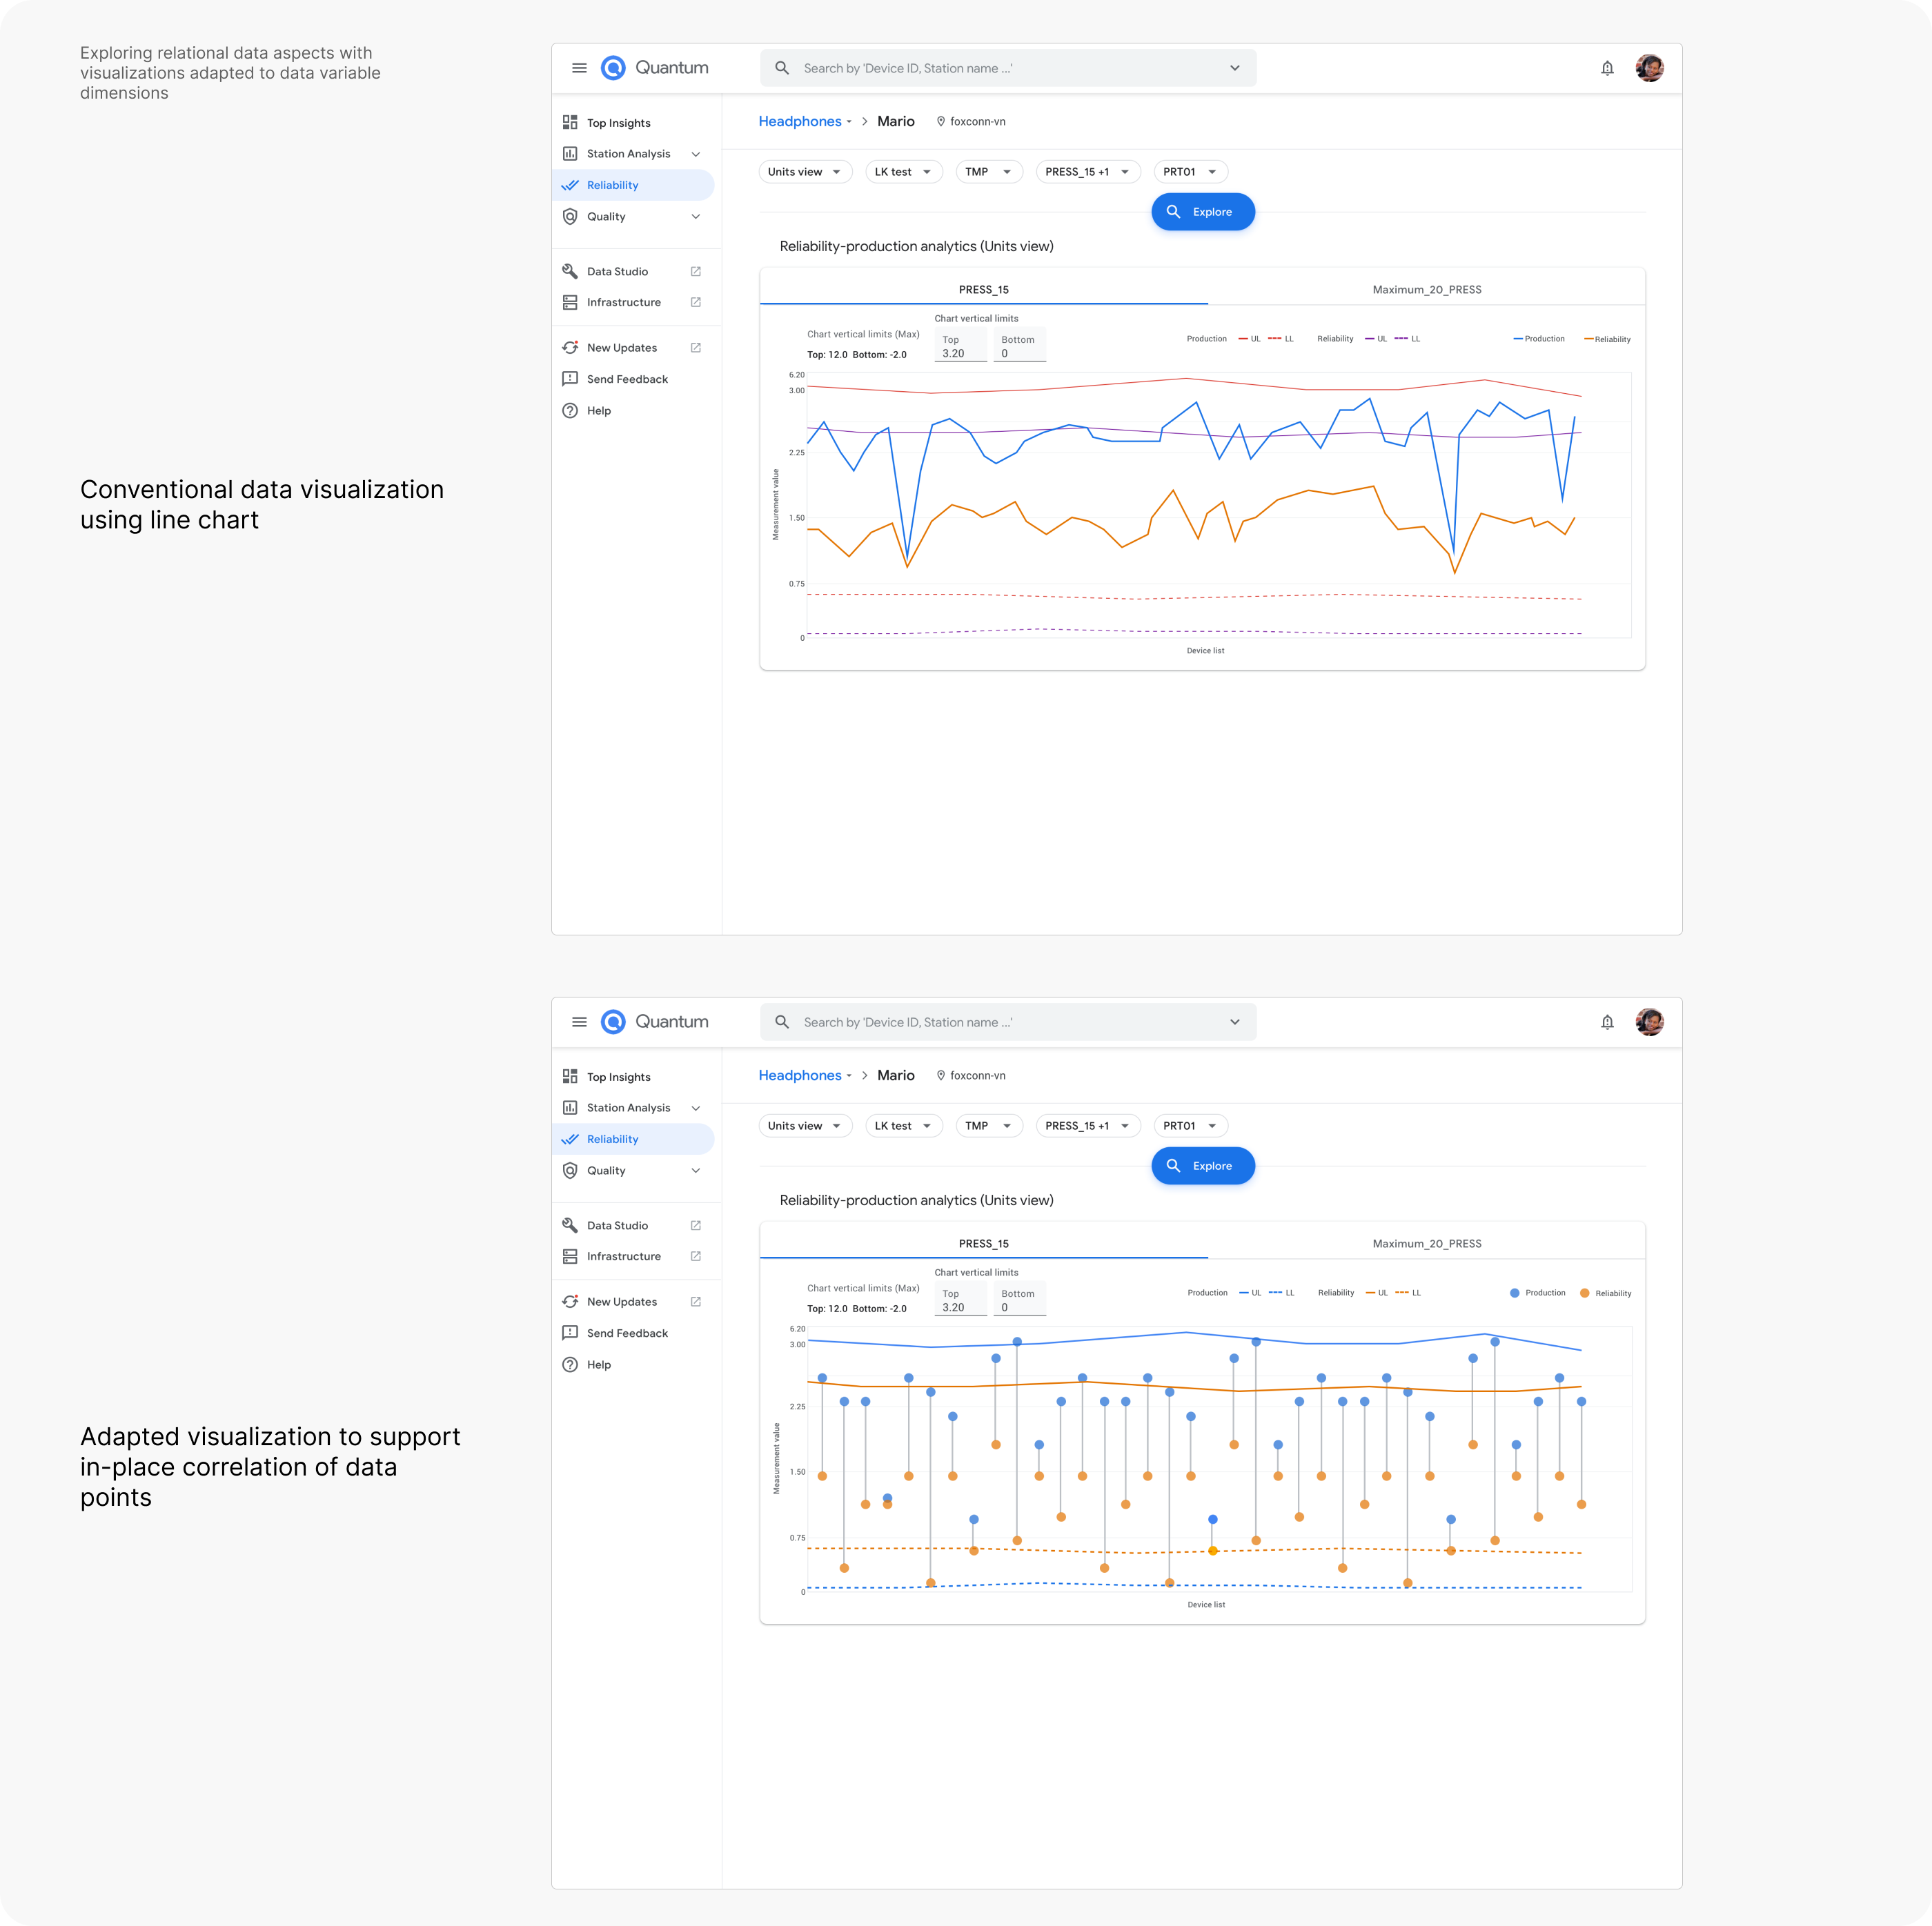
Relative Data Visualization
Moving away from conventional charts to explore more effective ways to represent relative aspects of data.
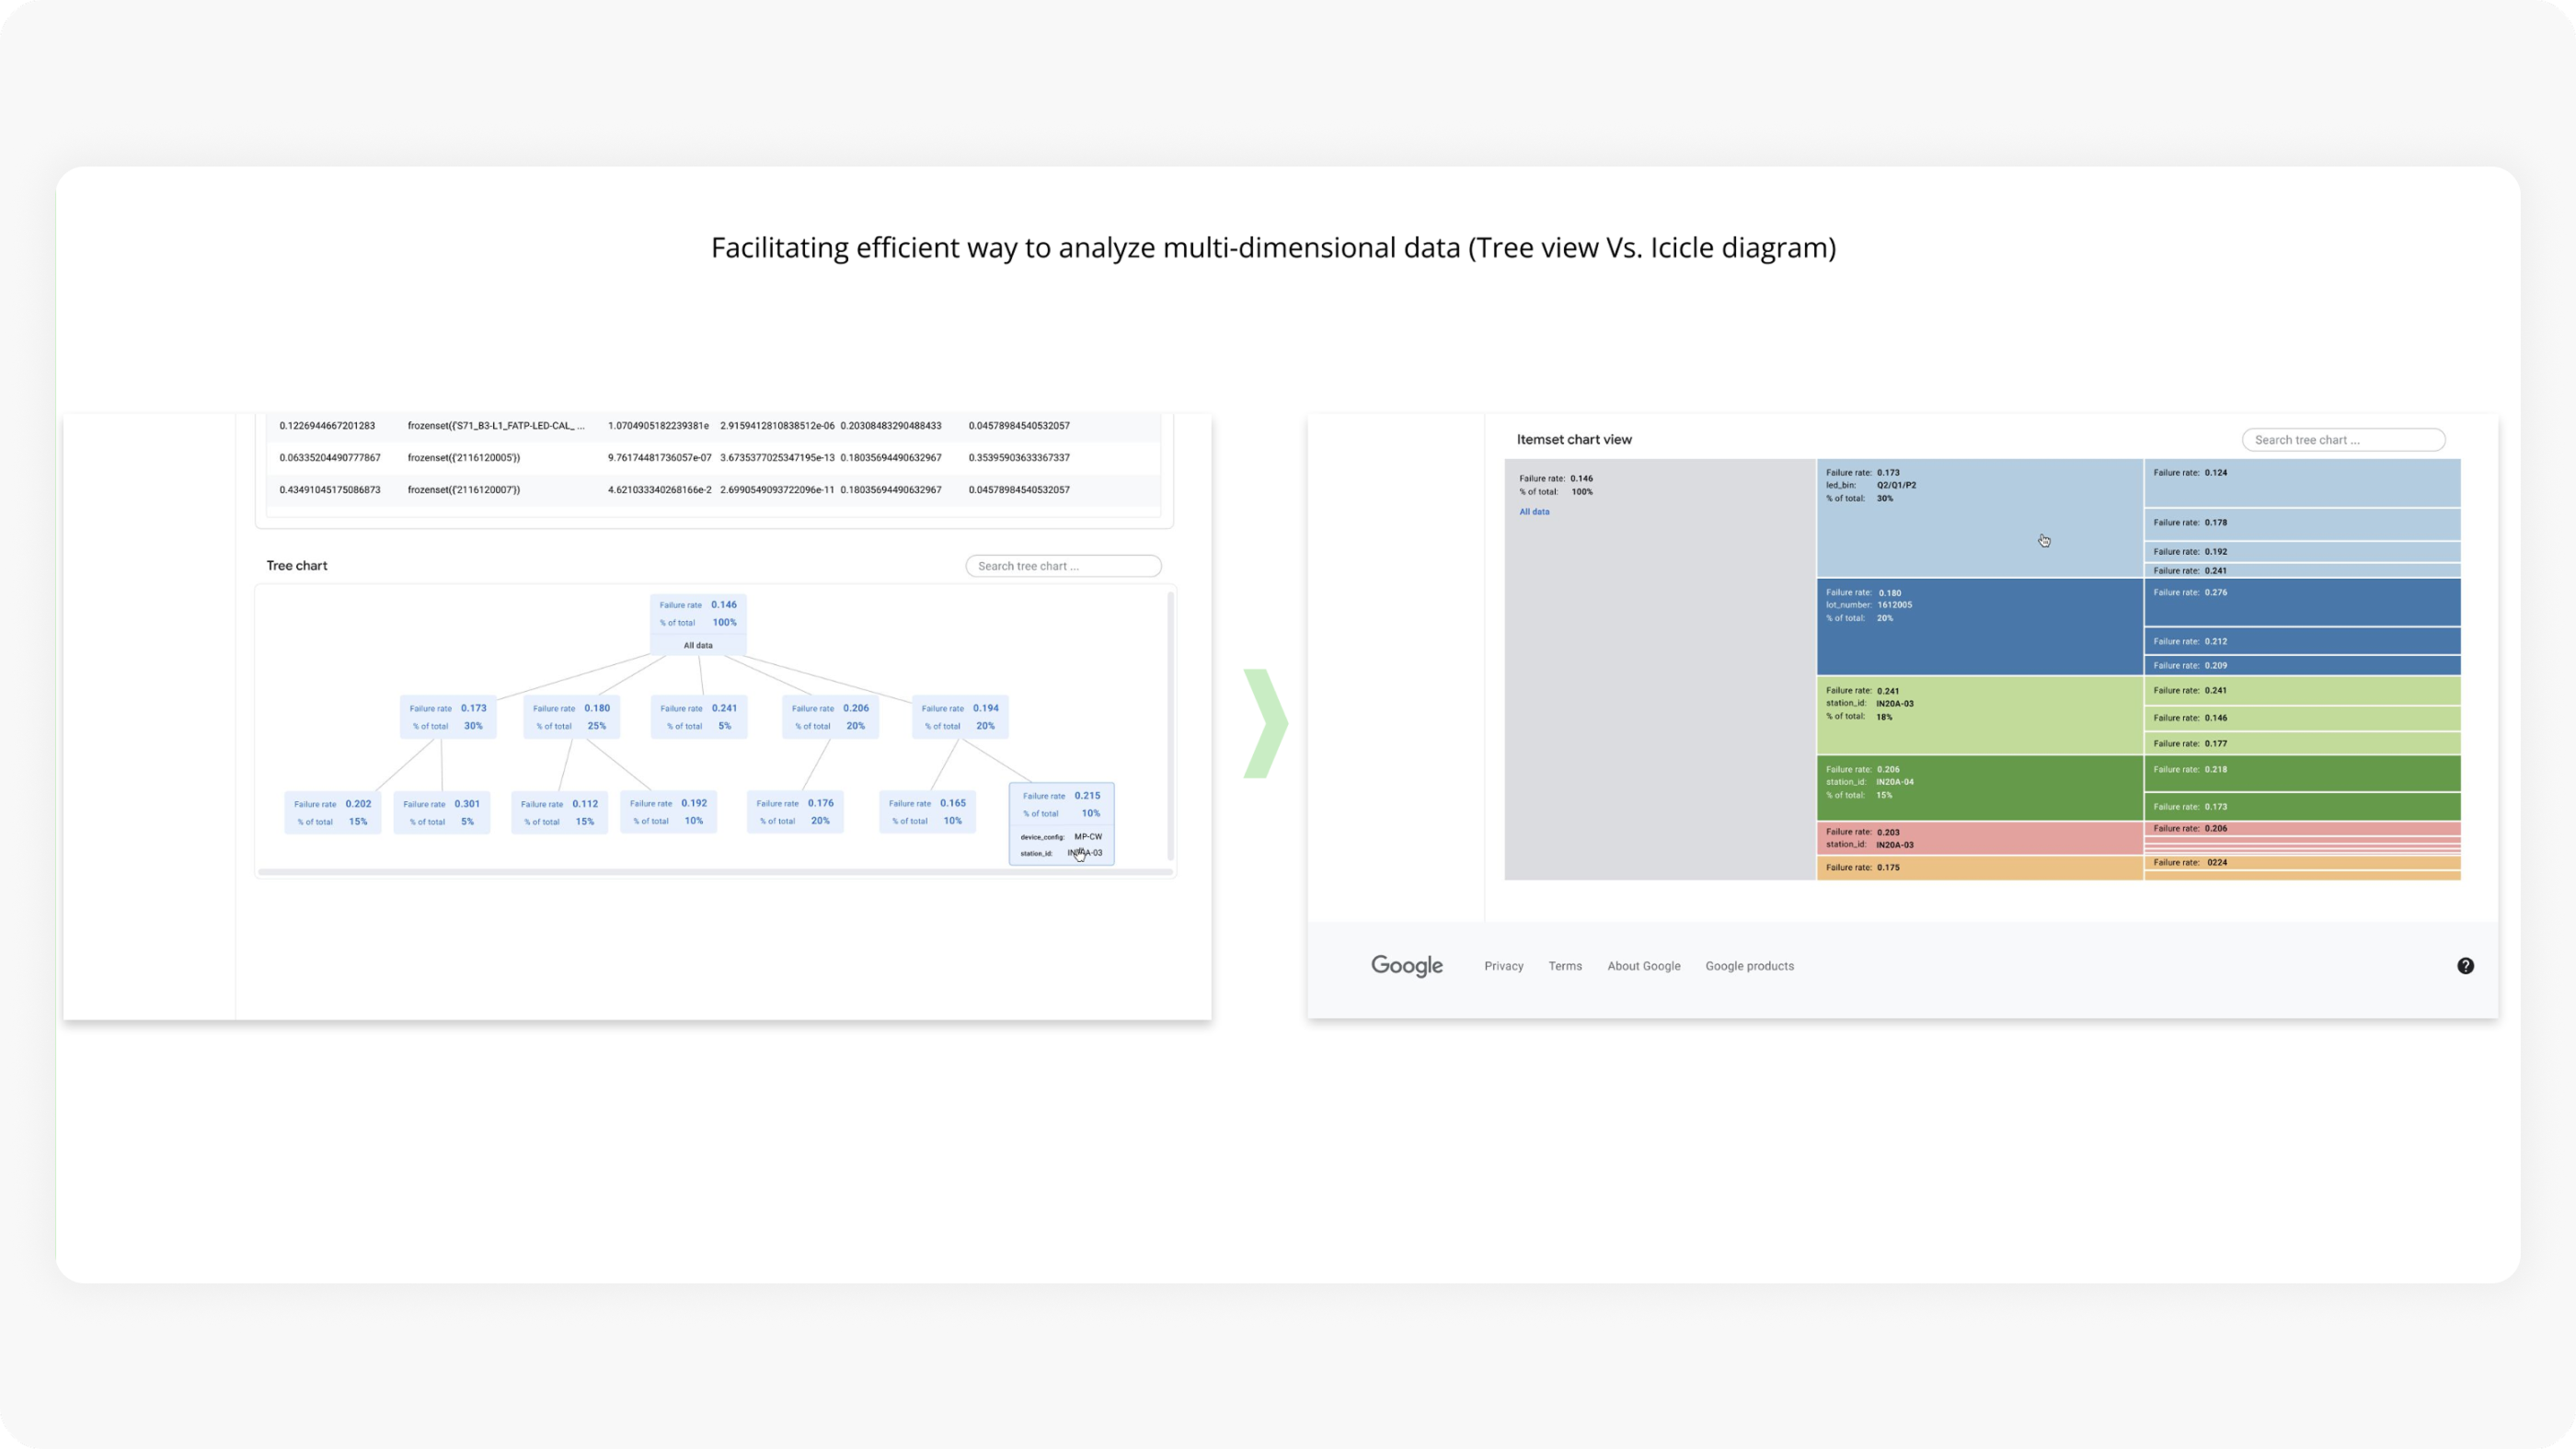
Multi-Dimensional Data Insights
Facilitating efficient analysis of multi-dimensional data — evaluating tree view vs. icicle diagram approaches.
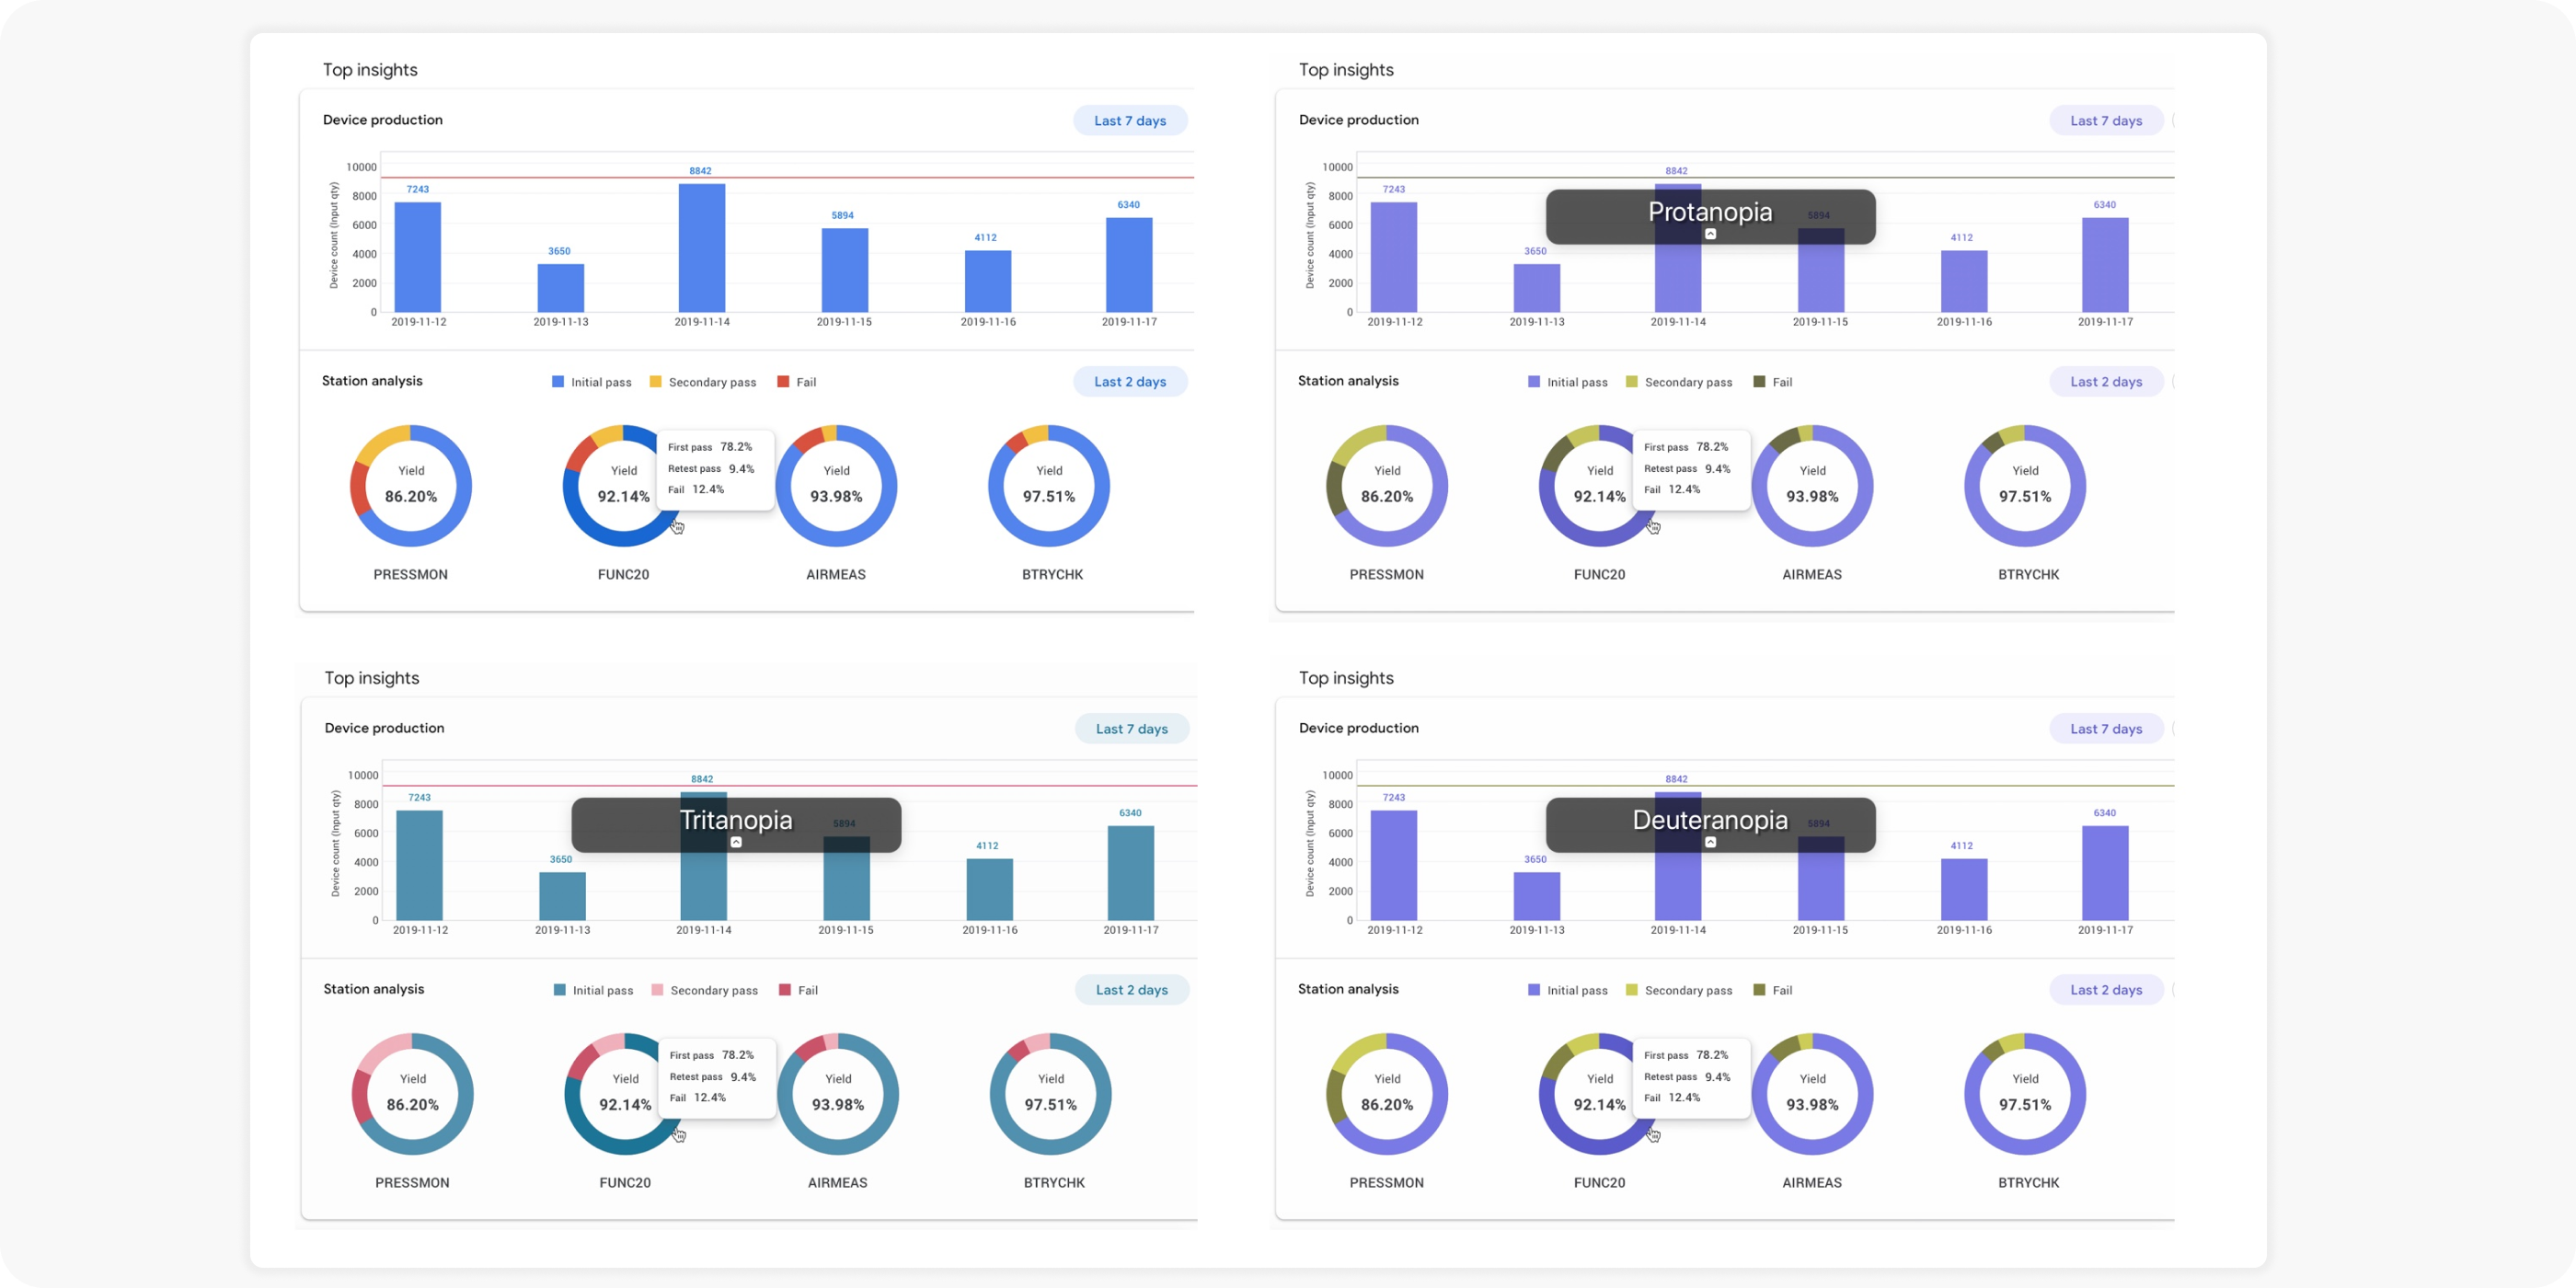
Accessibility
Validating with a11y recommendations for voice-over, contrast ratio checks, and vision tests.
The Solution
Leveraging ML to synthesize high-level, glanceable insights that deliver the most value to users
An intuitive, conversational approach to explore data insights — minimizing complex query filters
A single specification across cross-functional teams for consistent analysis and projections
Top Insights
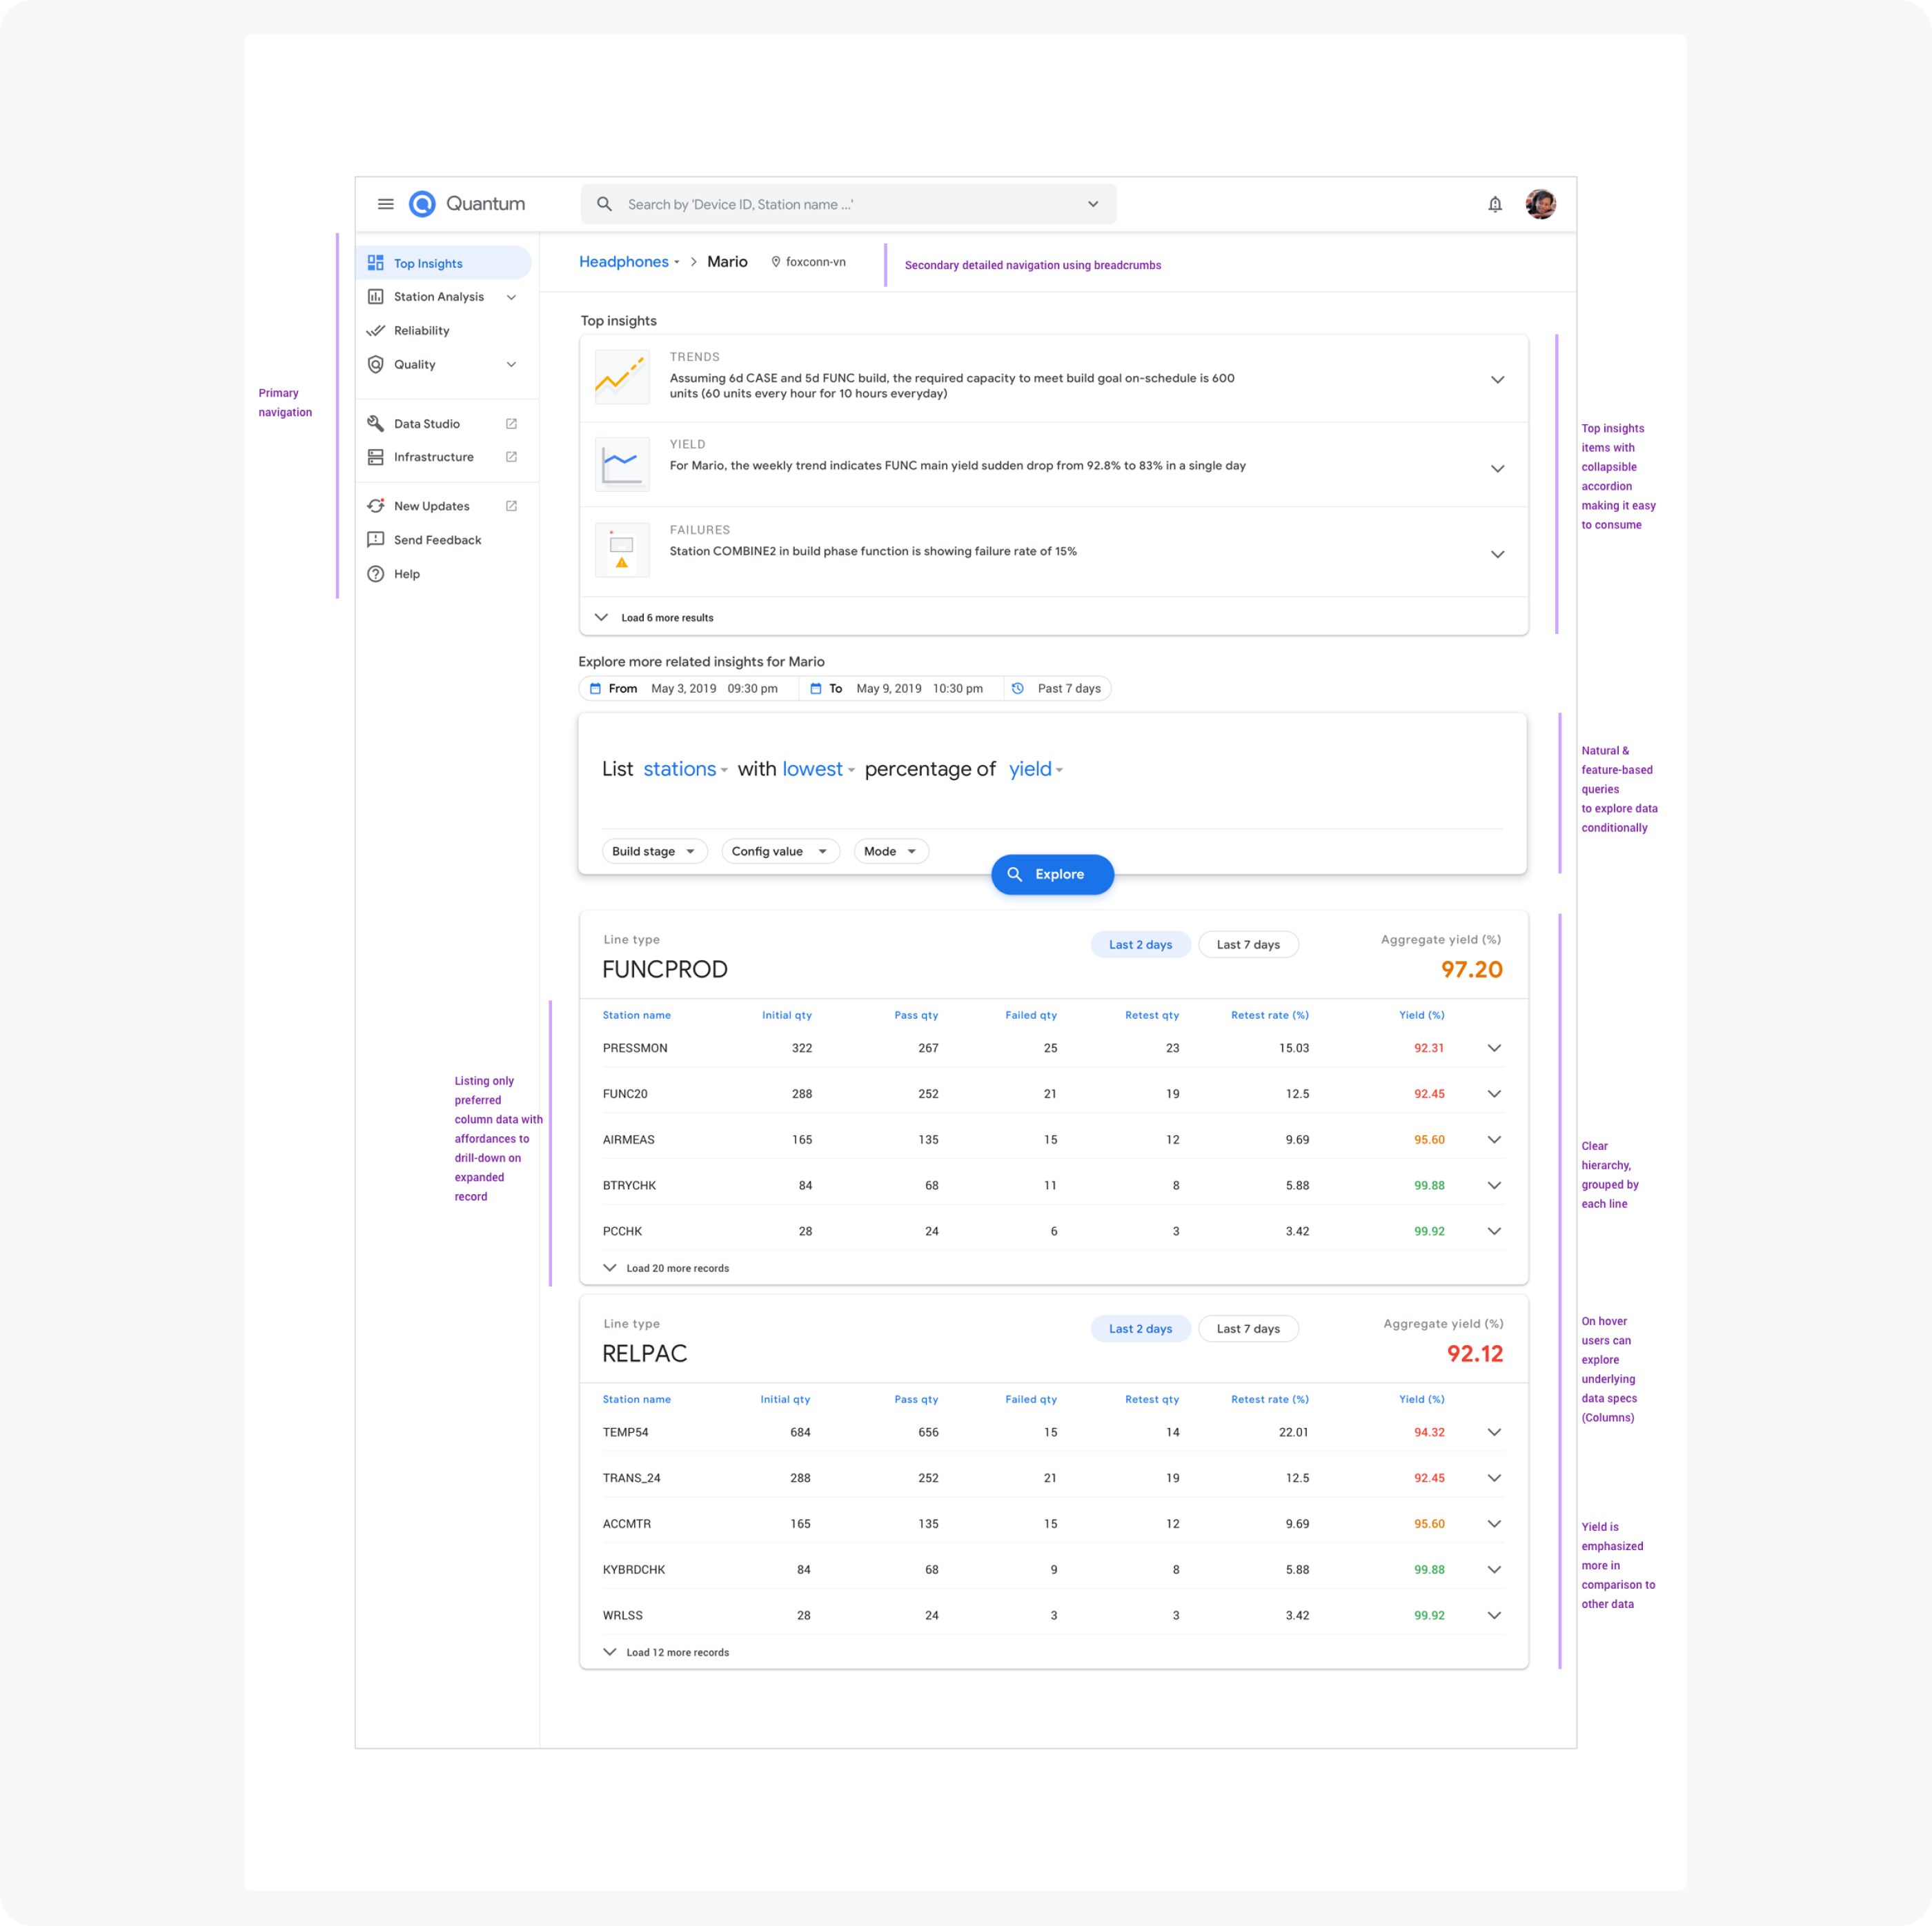
Feature-based Data Exploration
Centralized Data Specifications
Impact
Increase in daily yield (units produced) overall
Increment in page visits per week after launch — adopted by other cross-functional teams
Average time saved for test engineers troubleshooting station issues
Reduction in product returns from customers to Failure Analysis